General Dynamics (GD) Fundamental and Technical Stock Analysis: Can the Defence Prime Keep Outperforming?
$364.70
04 Mar 2026, 12:54
Neutral

Join Minipip Academy and access free courses in investing, trading, economics, and more.
Sign Up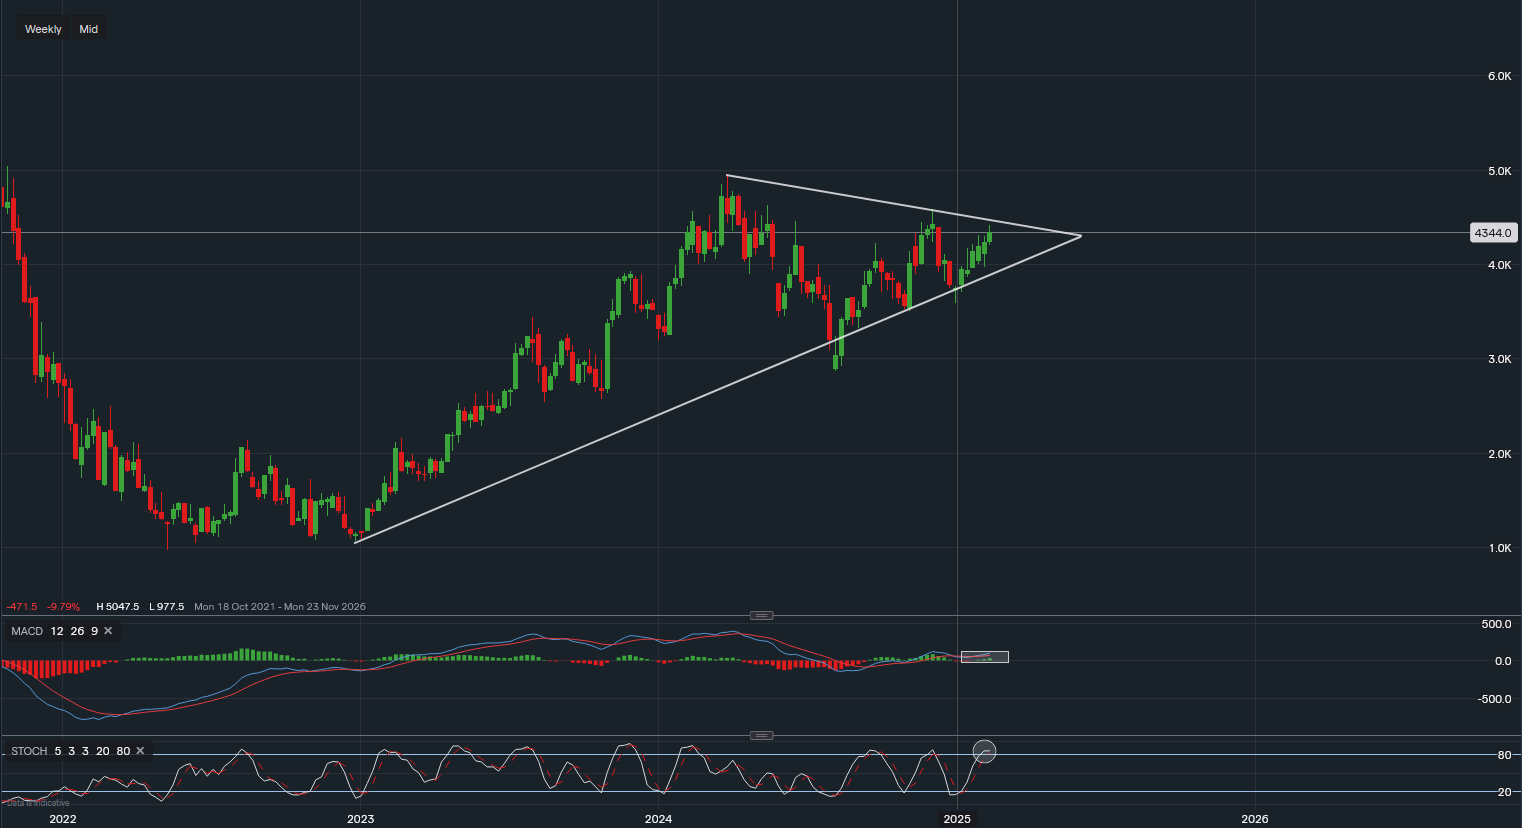
Chart & Data from IG
DraftKings (NASDAQ: DKNG) closed the last trading session at $43.44 per share, extending its weekly winning streak to seven consecutive weeks. This sustained rally indicates strong bullish momentum, but technical indicators suggest a potential near-term pullback as earnings approach.
With quarterly earnings set for tomorrow, investors are watching whether DraftKings can break above key resistance or face a potential pullback:
Resistance: $44.55 (upper trendline of the wedge). A break above this level could trigger a rally toward $49.55 as buyers step in.
Support: $39 (lower trendline support). A break below this level could lead to further declines toward $35.97, and possibly $35.11 if selling pressure intensifies.
With DraftKings stock recovering from last year’s April-July pullback, it now sits at a pivotal point heading into Q1 2025. The upcoming earnings report could be the catalyst for a breakout or a reversal, making these key price levels critical for traders and investors.
Will DraftKings continue its seven-week rally or see a post-earnings correction? Keep an eye on $44.55 resistance and $39 support for market direction.

Tradable assets:
Min.Deposit:
Max Leverage:
FCA:

Rating:


 Earnings Calendar
  Economic Calendar
  VAT Calculator
  Tax Free Childcare Calculator
 Percentage Calculator
 Compound Interest Calculator
  Loan Overpayment Calculator
 Mortgage Calculator
 Credit Card Calculator
 Investing
  Economics
 Trading
  Technical Analysis
  Personal Finance
 Calculator


