General Dynamics (GD) Fundamental and Technical Stock Analysis: Can the Defence Prime Keep Outperforming?
$364.70
04 Mar 2026, 12:54
Neutral

Join Minipip Academy and access free courses in investing, trading, economics, and more.
Sign Up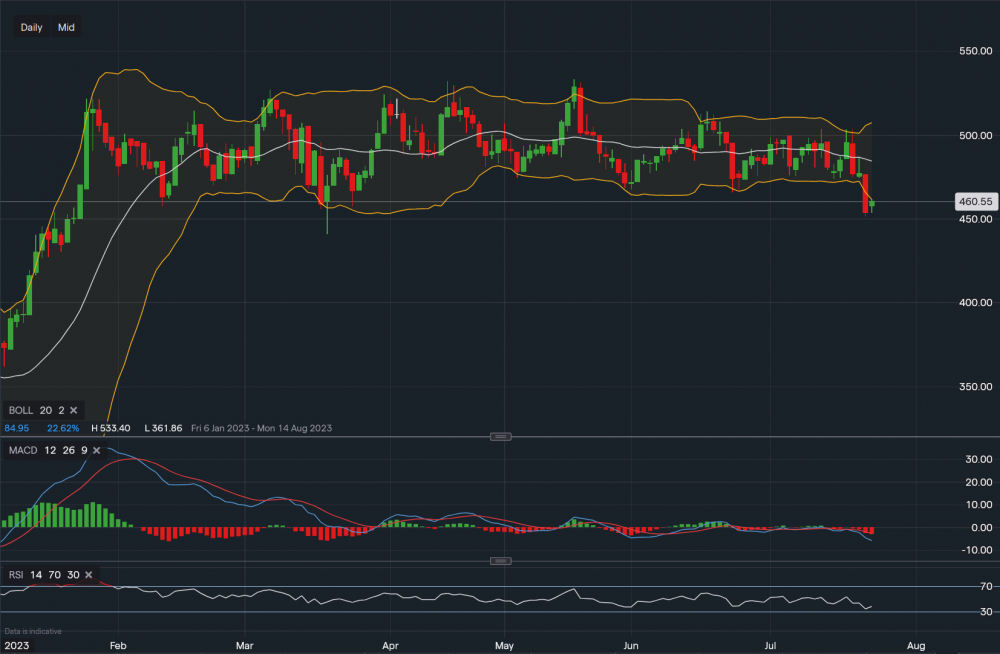
Chart & Data from IG
Taking a look at EasyJet as it has been trading sideways for some time and it has now fallen towards the bottom of its price range. Looking at the daily interval, we can see that on the 20th of July the price has fallen below the middle moving average of the Bollinger Bands, it has actually broken through the bottom band as well (465p). Currently trading at around 459p a share, the support sits at 457p then at 451p and then the key level at 440p. A break and close below 440p could see the price slide lower to the range of 420-430p a share. As the price has pierced through the lower Bollinger Band, we might see a bounce higher. Hence, resistance sits at 472p and then at 476p. Though this level may now be tough to reach, if it did, we then would look towards the resistance corresponding with the current middle moving average of 484p. Looking at the technical indicators, MACD has confirmed a negative outlook and RSI has fallen and is also negative as it reads 38.


 Earnings Calendar
  Economic Calendar
  VAT Calculator
  Tax Free Childcare Calculator
 Percentage Calculator
 Compound Interest Calculator
  Loan Overpayment Calculator
 Mortgage Calculator
 Credit Card Calculator
 Investing
  Economics
 Trading
  Technical Analysis
  Personal Finance
 Calculator


