Netflix Stock Analysis: Is a Bullish Reversal Forming?
$90.21
09 Jan 2026, 09:52

Chart & Data from IG

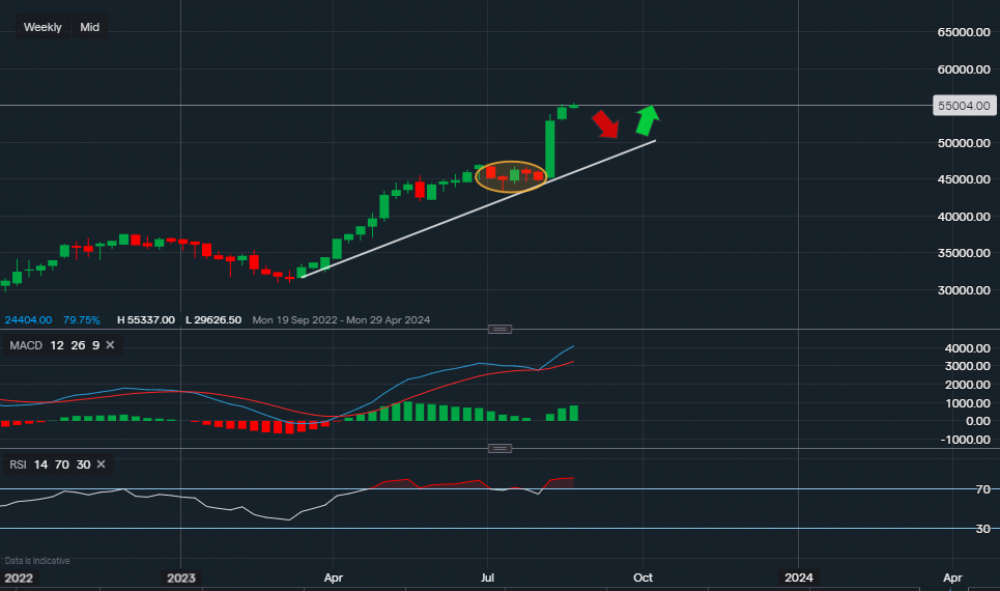
We analysed Eli Lilly’s stock earlier this month (7th), when the stock’s price back then was sitting around $449 a share. It is now trading at around $550.04 a share, which is a 22% increase in just over 2 weeks. We can see some profit-taking took place in July before the spike higher on the week commencing 7th of August. As the stock has set a new all-time high and with the market sentiment on edge at the moment, due to fears of further interest rates, we may see a similar pullback as highlighted by the yellow oval. In that scenario, we would expect a short-term pullback towards the trendline before continuing higher (arrows). But of course, this is not guaranteed and we may simply just see the price grind in the upside direction, reaching an even higher all-time high. Support along the trendline reads approximately $485.46, a break could see a test of $434.36. Although, at this moment in time the bias is bullish. However, investors and traders should approach with caution. If we look at the technical indicators based on the weekly timeframe, the RSI is showing signs of oversold conditions. RSI is reading 80, but the MACD is very positive so it may be a case of a small retracement before a rise higher.