General Dynamics (GD) Fundamental and Technical Stock Analysis: Can the Defence Prime Keep Outperforming?
$364.70
04 Mar 2026, 12:54
Neutral

Join Minipip Academy and access free courses in investing, trading, economics, and more.
Sign Up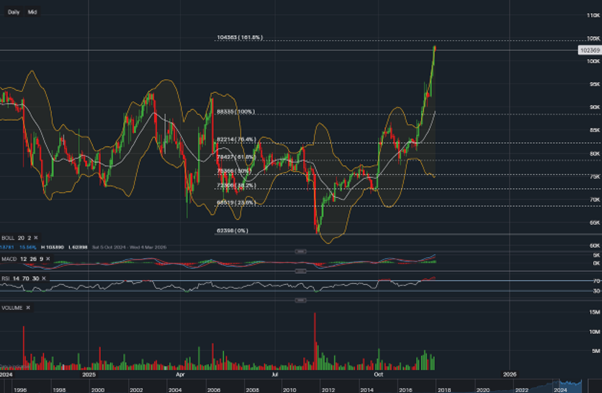
Eli Lilly Stock Analysis: Is the Bullish Rally Set to Continue?
Eli Lilly’s share price surged following its earnings report on Thursday, 30 October, delivering an impressive 25.44% gain. With momentum running high, many traders are now asking the same question: can this rally continue, or is a reversal on the horizon?
Technical Analysis: Overbought Conditions Emerging
Eli Lilly is currently trading at all-time highs, with price action pushing firmly against the upper Bollinger Band. The Relative Strength Index (RSI) stands at 84, a level typically considered very overbought, suggesting that a short-term pullback may be due.
However, bullish momentum remains strong:
If momentum continues, Eli Lilly could target the next Fibonacci resistance level at $1,043.63. Still, as the MACD is a lagging indicator, these signals should be interpreted with caution.
Fundamental Analysis: Signs of Overvaluation
From a fundamental perspective, Eli Lilly appears to be priced at a premium:
These valuations suggest the stock may be overvalued relative to future earnings expectations.
Additionally, analysts’ average price target stands at $999.28, implying a 2.44% downside from current levels. This could indicate that further gains may be limited as the market digests recent price appreciation.
Outlook for Traders and Investors
Following a strong earnings report, Eli Lilly has experienced a significant re-rating, driving the stock up more than 25%. However, elevated P/E ratios and analyst forecasts suggest the stock may now be approaching overvalued territory.
While a retracement could be likely, strong momentum—particularly the robust MACD signal—indicates this pullback may not occur immediately. Traders and investors should monitor key Fibonacci levels and momentum indicators for potential entry and exit opportunities.

Tradable assets:
Min.Deposit:
Max Leverage:
FCA:

Rating:


 Earnings Calendar
  Economic Calendar
  VAT Calculator
  Tax Free Childcare Calculator
 Percentage Calculator
 Compound Interest Calculator
  Loan Overpayment Calculator
 Mortgage Calculator
 Credit Card Calculator
 Investing
  Economics
 Trading
  Technical Analysis
  Personal Finance
 Calculator


