General Dynamics (GD) Fundamental and Technical Stock Analysis: Can the Defence Prime Keep Outperforming?
$364.70
04 Mar 2026, 12:54
Neutral

Join Minipip Academy and access free courses in investing, trading, economics, and more.
Sign Up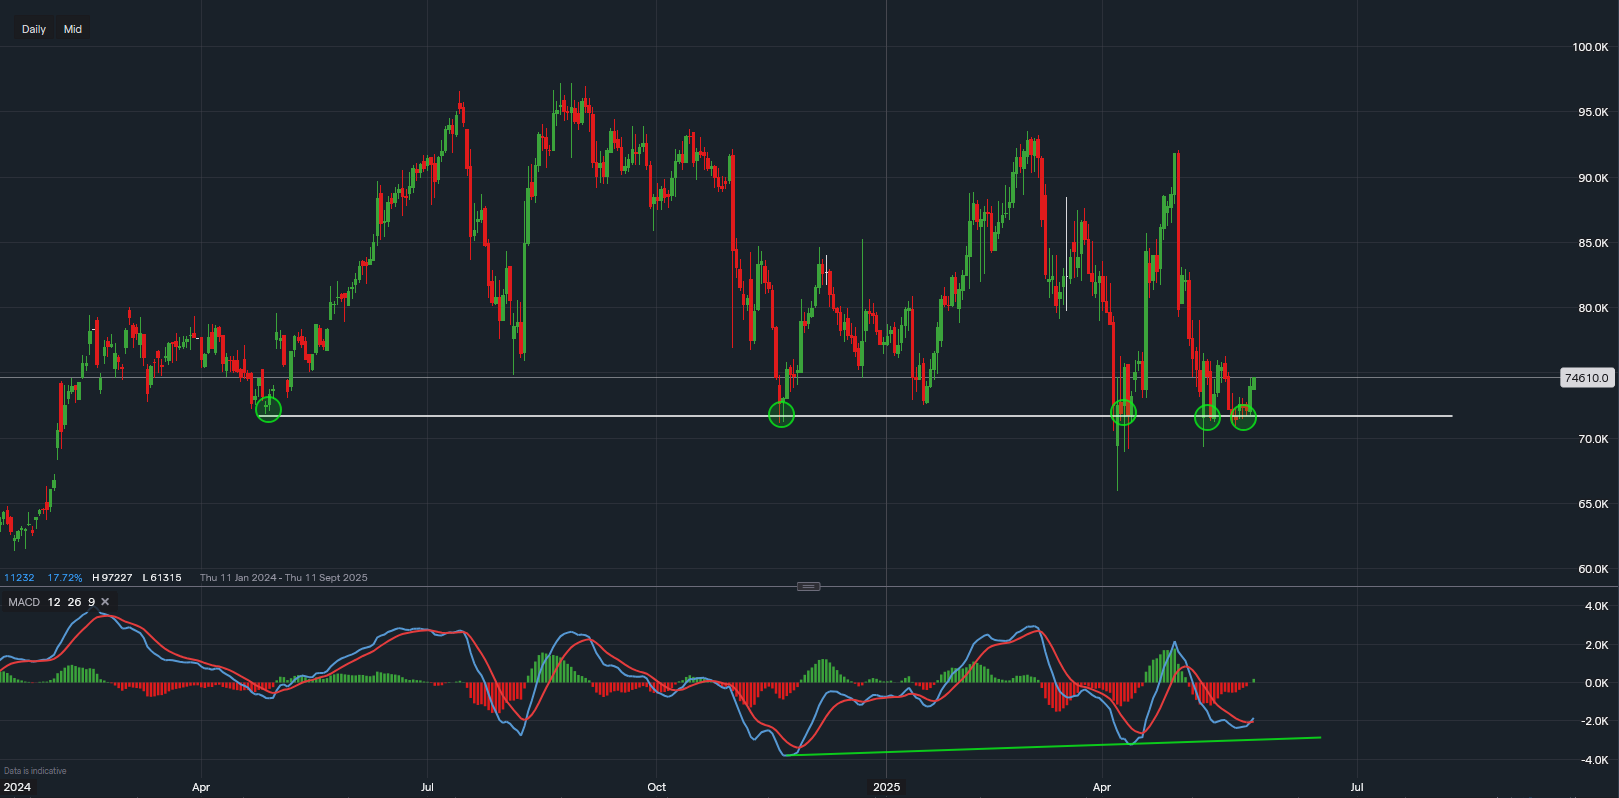
Chart & Data from IG
Eli Lilly & Co. (LLY) appears to be showing signs of a potential short-term upside, according to recent technical analysis on the daily timeframe. The pharmaceutical giant’s share price has tested a key support level for the fifth time since April last year—suggesting strong buyer interest at this zone.
As of pre-market trading, Eli Lilly shares are priced at approximately $746.10. The critical support area between $715 and $717 continues to hold firm, acting as a solid base. If the price were to close below this level, it could indicate further downside risk, potentially pushing the stock towards the $650 range, with additional technical support seen around $615.
However, recent price action suggests bullish momentum may be returning. The Moving Average Convergence Divergence (MACD) indicator has turned positive on the daily chart for the first time since mid-April. Additionally, the MACD shows a possible medium-strength bullish divergence—where the indicator is making higher lows while the price remains range-bound rather than forming lower lows. This pattern often precedes upward movement and could attract more buyers.
Investors and traders should monitor resistance levels at $765. A decisive break above this level could pave the way for an extended move towards the psychological $800 mark, where some profit-taking may occur.
Final Thoughts
Eli Lilly stock remains one to watch closely in the short term. With firm support holding and momentum indicators turning bullish, there’s a growing case for a potential rally—particularly if key resistance levels are breached. As always, risk management is crucial, especially with price action nearing significant technical thresholds.

Tradable assets:
Min.Deposit:
Max Leverage:
FCA:

Rating:


 Earnings Calendar
  Economic Calendar
  VAT Calculator
  Tax Free Childcare Calculator
 Percentage Calculator
 Compound Interest Calculator
  Loan Overpayment Calculator
 Mortgage Calculator
 Credit Card Calculator
 Investing
  Economics
 Trading
  Technical Analysis
  Personal Finance
 Calculator


