General Dynamics (GD) Fundamental and Technical Stock Analysis: Can the Defence Prime Keep Outperforming?
$364.70
04 Mar 2026, 12:54
Neutral

Join Minipip Academy and access free courses in investing, trading, economics, and more.
Sign Up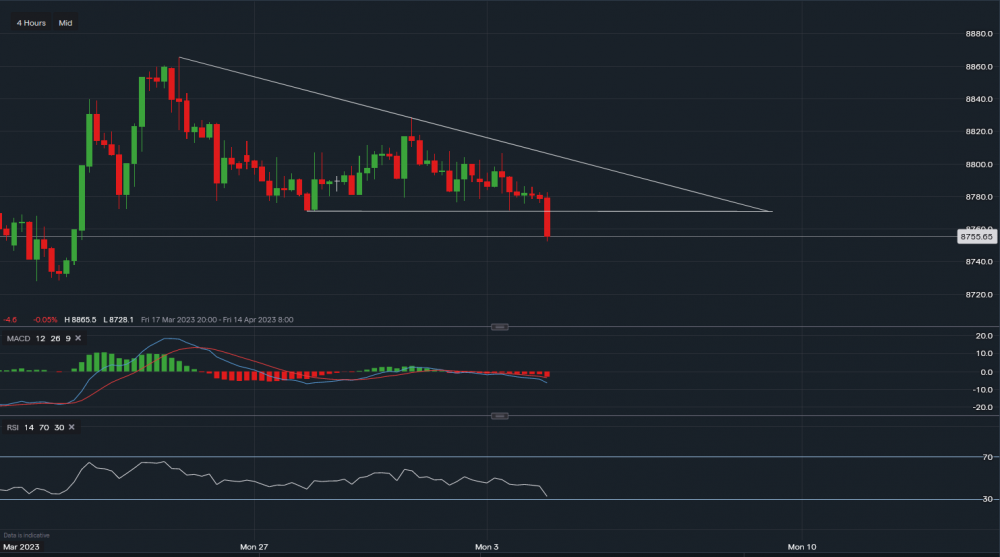
Chart & Data from IG
The euro is now trading at around €0.8755 against the pound. Last week, the forex pair broke out of the descending triangle suggesting a bullish price movement, however, this resulted in a ‘false’ breakout with the resistance then upholding its strength. We can now see that the initial bearish movement is in play, with the forex pair breaking the key support level sitting at €0.8771. Due to this break below, the price could now slide further towards support sitting at €0.8728. Looking at the technical indicators, the MACD is negative and so is the RSI as it reads 31. Although the RSI is heading towards ‘oversold’ territory, hence a pullback higher may occur in the short term. Previous support of €0.8771 is now acting as resistance.


 Earnings Calendar
  Economic Calendar
  VAT Calculator
  Tax Free Childcare Calculator
 Percentage Calculator
 Compound Interest Calculator
  Loan Overpayment Calculator
 Mortgage Calculator
 Credit Card Calculator
 Investing
  Economics
 Trading
  Technical Analysis
  Personal Finance
 Calculator


