General Dynamics (GD) Fundamental and Technical Stock Analysis: Can the Defence Prime Keep Outperforming?
$364.70
04 Mar 2026, 12:54
Neutral

Join Minipip Academy and access free courses in investing, trading, economics, and more.
Sign Up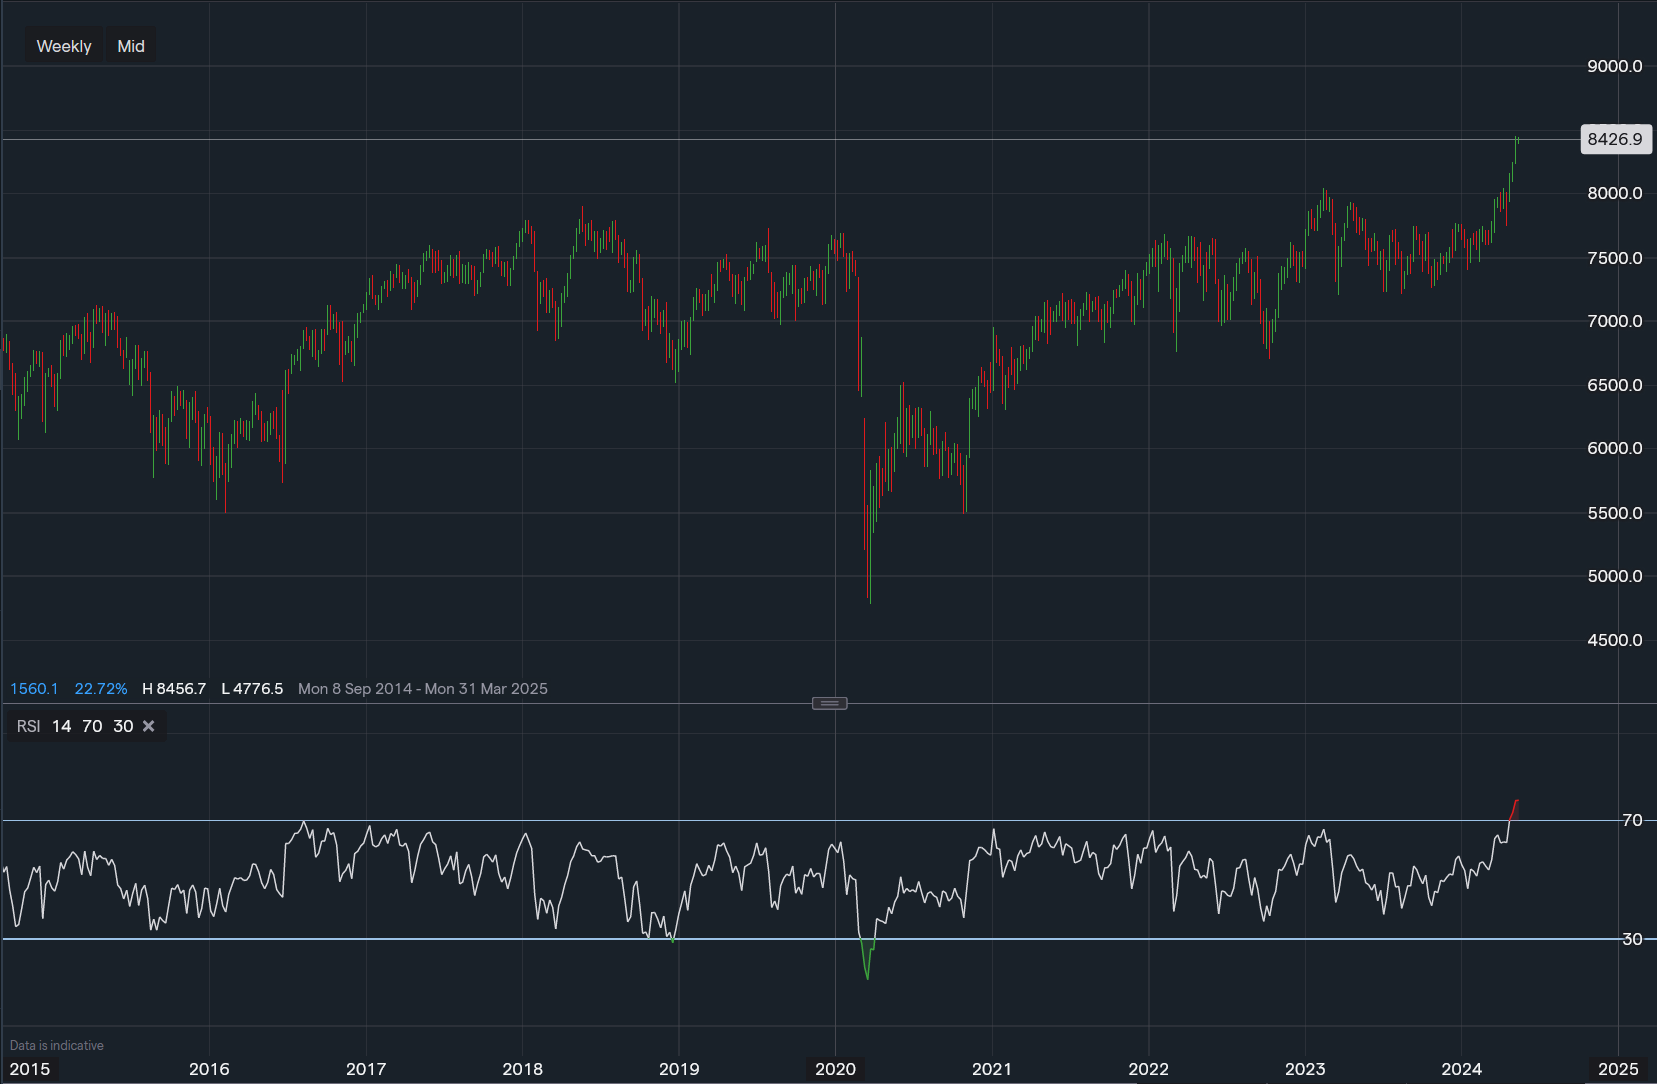
The FTSE100 is currently reading 76 on the weekly timeframe and 79 on the daily timeframe. Looking back at the chart, the last time the FTSE was this overbought was in 2006, however, the index did continue to push higher before the 2007-2008 crisis saw the index drop significantly. Looking at the daily timeframe the RSI is also very high suggesting overbought conditions. this has happened 7 times since 2023 (excluding the current upside move) and each time has resulted in the index eventually falling before moving higher or staying rangebound.
Looking at the current chart, the FTSE has a tough resistance at 8,500, with a break above this possibly opening the door to 9,000. The FTSE has lagged behind the rest of the year for some years now and could be playing catchup as a high-interest rate environment sees banks perform better and companies with large cash holdings too, of which the FTSE has many constituents in which do.
Towards the downside support for the index initially is around 8,200 with a break below their targetting 8,000. It is also worth noting that MACD is positive, but momentum is slowing and it could likely turn negative this week if the market can't continue to break out higher.

Tradable assets:
Min.Deposit:
Max Leverage:
FCA:

Rating:


 Earnings Calendar
  Economic Calendar
  VAT Calculator
  Tax Free Childcare Calculator
 Percentage Calculator
 Compound Interest Calculator
  Loan Overpayment Calculator
 Mortgage Calculator
 Credit Card Calculator
 Investing
  Economics
 Trading
  Technical Analysis
  Personal Finance
 Calculator


