General Dynamics (GD) Fundamental and Technical Stock Analysis: Can the Defence Prime Keep Outperforming?
$364.70
04 Mar 2026, 12:54
Neutral

Join Minipip Academy and access free courses in investing, trading, economics, and more.
Sign Up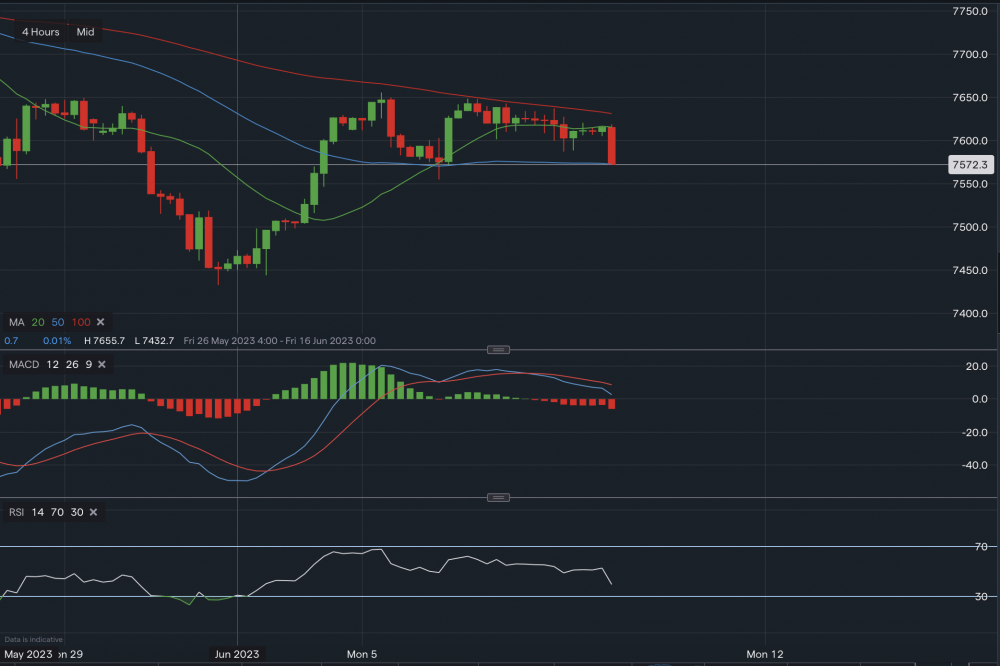
Chart & Data from IG
The FTSE 100 index is now approaching the support along the 50-day moving average (7,572). Currently trading at round 7,573. FTSE attempted to break through the resistance of 7,615 (20-day MA) earlier, but the resistance held out and bears remain in control. A break and close below the 50-day MA could see the index slide lower towards the next key support level of 7,555. If consolidation along the 50-day MA occurs, we would then look towards resistance levels of 7,600 and then once again the 20-day MA point of 7,615. A break above 7,615 could see a move towards the tough resistance along the 100-day MA (7,631). The technical indicators are both currently negative, with the RSI reading 41 and faltering.

Tradable assets:
Min.Deposit:
Max Leverage:
FCA:

Rating:


 Earnings Calendar
  Economic Calendar
  VAT Calculator
  Tax Free Childcare Calculator
 Percentage Calculator
 Compound Interest Calculator
  Loan Overpayment Calculator
 Mortgage Calculator
 Credit Card Calculator
 Investing
  Economics
 Trading
  Technical Analysis
  Personal Finance
 Calculator


