General Dynamics (GD) Fundamental and Technical Stock Analysis: Can the Defence Prime Keep Outperforming?
$364.70
04 Mar 2026, 12:54
Neutral

Join Minipip Academy and access free courses in investing, trading, economics, and more.
Sign Up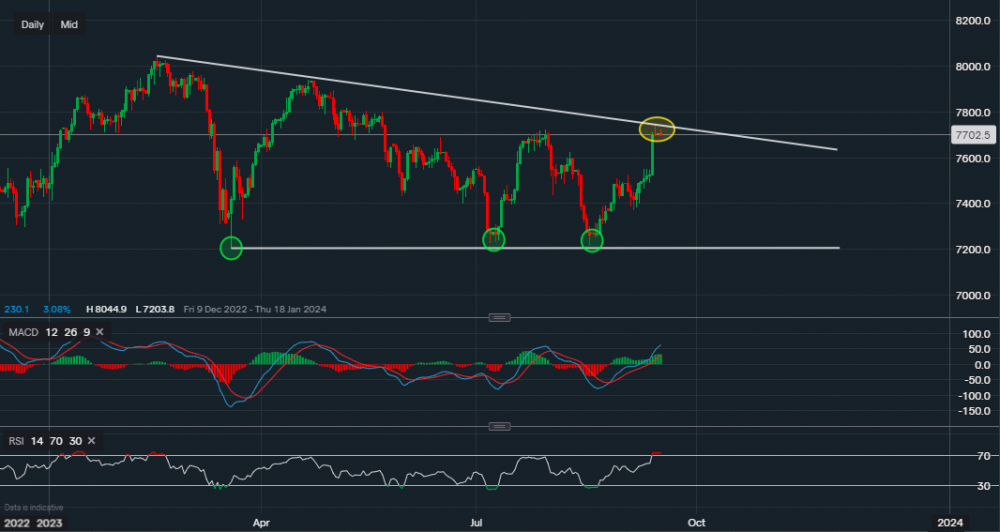
Chart & Data from IG
The FTSE 100 index is currently trading at around 7,702. If we look at the chart from a technical perspective, we can see that on the daily timeframe, the price tried to break through the resistance of 7,747 but failed on Friday. Looking at the candlestick it was clearly too challenging for the index, especially prior to the UK CPI and interest rate decision in the upcoming days. This resistance dates back to the 16th of February, which we can now see was the starting point of the downtrend. This resistance corresponds with the descending upper trendline which highlights the bearish ongoing trend (yellow oval). A break above the upper trendline could be an indication that we have begun a new bull trend. But until then, the bias remains bearish. Towards the downside, we can see a support base has been formed along the lower trendline, with the lowest reading of 7,203. The index came close to testing this support on two different occasions but managed to close higher, these are highlighted by the green ovals. Another retracement back to those levels could be a signal that the FTSE is struggling to gain enough momentum to break higher. In that scenario, a potential exhaustion may lead to a break below 7,203. Looking at the technical indicators, MACD and the RSI are still positive with the RSI reading 73. However, the RSI does suggest that the index is overbought. Hence, we could see a pullback over the next couple of days.

Tradable assets:
Min.Deposit:
Max Leverage:
FCA:

Rating:


 Earnings Calendar
  Economic Calendar
  VAT Calculator
  Tax Free Childcare Calculator
 Percentage Calculator
 Compound Interest Calculator
  Loan Overpayment Calculator
 Mortgage Calculator
 Credit Card Calculator
 Investing
  Economics
 Trading
  Technical Analysis
  Personal Finance
 Calculator


