AbbVie (ABBV) Stock Analysis: Humira Decline, New Drug Growth, and Technical Consolidation
$228.47
06 Mar 2026, 17:58
Neutral

Join Minipip Academy and access free courses in investing, trading, economics, and more.
Sign Up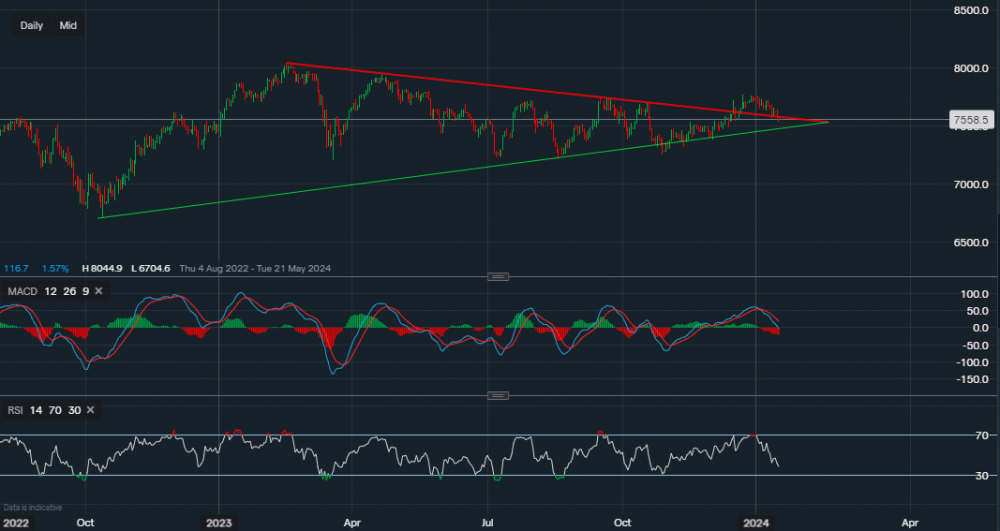
Chart & Data from IG
Taking a look at the FTSE 100 as the index is still undergoing its decline due to the soured global sentiment. Currently, the index is trading at around 7,558. Looking at the daily chart, we can see that today it has slipped back into the triangle area and now testing the support of 7,546. A close within the triangle would be a bearish indication and a close below 5,546 could confirm this. This may lead to a further decline towards the ascending trendline of the triangle (green), which reads 7,480. The green trendline has been the key support driver here for the FTSE, even last year. It would be unreliable to point out any resistance levels for the time being as the short-term bias seems to be shifting, but the previous trendline support of 7,577 (red) is now acting as the primary resistance. A break and close above would then create a resistance to support flip, allowing the bulls to look higher towards 7,642 and 7,670. Looking at the technical indicators, both support the bearish bias for the shorter term. The MACD is negative and falling with the RSI also now negative as it reads 38.
 (Chart & Data from IG)

Tradable assets:
Min.Deposit:
Max Leverage:
FCA:

Rating:


 Earnings Calendar
  Economic Calendar
  VAT Calculator
  Tax Free Childcare Calculator
 Percentage Calculator
 Compound Interest Calculator
  Loan Overpayment Calculator
 Mortgage Calculator
 Credit Card Calculator
 Investing
  Economics
 Trading
  Technical Analysis
  Personal Finance
 Calculator


