General Dynamics (GD) Fundamental and Technical Stock Analysis: Can the Defence Prime Keep Outperforming?
$364.70
04 Mar 2026, 12:54
Neutral

Join Minipip Academy and access free courses in investing, trading, economics, and more.
Sign Up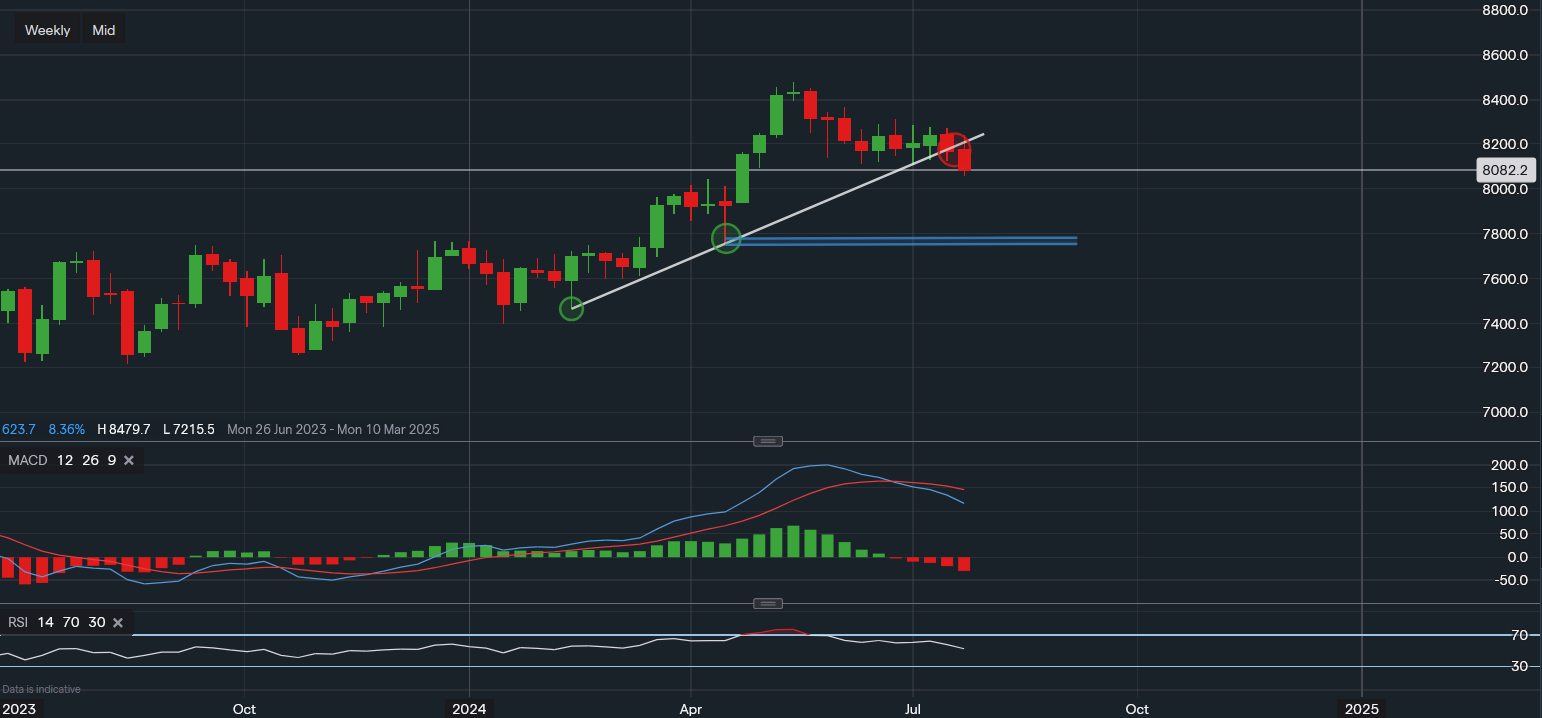
Chart & Data from IG
The FTSE 100 has now broken below the trendline support and the support in and around 8,100, which has been the primary focus over the past 6 weeks. As of now, the UK index is trading at around 8,082 and is down around 0.8% on the day. The next key area that traders and investors may focus on is the level of 7,750, outlined using the blue channel down below. Though there is potentially some support above around 7,855 that may provide some assistance in the near term. The reason why 7,750 will be of importance is that a move below could see the index erase all the gains from the year, possibly leading to a deeper sell-off as investors may move money into other markets. However, this is the worst-case scenario for now and would need to be analysed at the time. On the other hand, with the hopes that the Bank of England may soon start cutting interest rates and if the first cut was to happen sooner rather than later, the index may form a bottom above the support of 7,750. This would most definitely incentivise investors and traders to take a more risk-on approach for a move back towards all-time highs. We can see that the technical indicators are suggesting that bearish momentum is increasing, perhaps leading to some downside near-term. Nonetheless, the longer-term outlook remains bullish and thus far this is perceived as a market correction rather than a reversing trend.

Tradable assets:
Min.Deposit:
Max Leverage:
FCA:

Rating:


 Earnings Calendar
  Economic Calendar
  VAT Calculator
  Tax Free Childcare Calculator
 Percentage Calculator
 Compound Interest Calculator
  Loan Overpayment Calculator
 Mortgage Calculator
 Credit Card Calculator
 Investing
  Economics
 Trading
  Technical Analysis
  Personal Finance
 Calculator


