General Dynamics (GD) Fundamental and Technical Stock Analysis: Can the Defence Prime Keep Outperforming?
$364.70
04 Mar 2026, 12:54
Neutral

Join Minipip Academy and access free courses in investing, trading, economics, and more.
Sign Up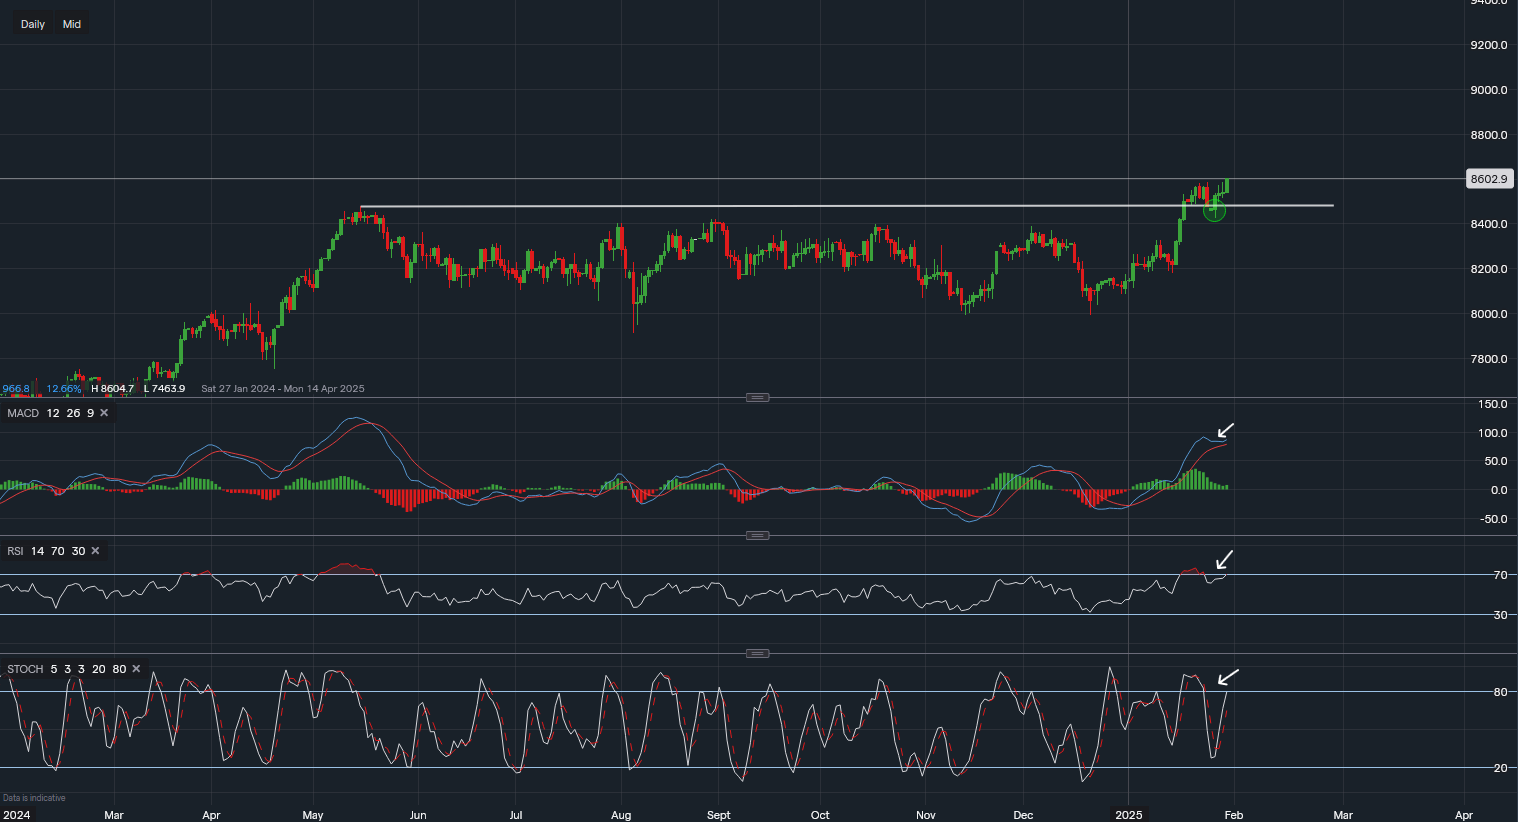
Chart & Data from IG
The FTSE 100 index has surged to new all-time highs, breaking above key resistance levels and continuing its upward momentum. Currently trading around 8,602, the index has successfully retested support at 8,479, a former resistance level, and has since rebounded.
With the index at record highs, technical indicators suggest there could be further upside potential. Despite the rally, the FTSE 100 is not yet in extreme overbought territory compared to past corrections, indicating room for more gains.
Traders are eyeing 8,700 and 8,800 as the next psychological resistance levels, where profit-taking could emerge—unless momentum starts to weaken.
In case of a pullback, traders may focus on:
As long as technical indicators remain supportive, the FTSE 100 may continue its bullish trend towards new highs. However, traders should monitor resistance levels, profit-taking signals, and potential shifts in momentum for signs of a reversal.

Tradable assets:
Min.Deposit:
Max Leverage:
FCA:

Rating:


 Earnings Calendar
  Economic Calendar
  VAT Calculator
  Tax Free Childcare Calculator
 Percentage Calculator
 Compound Interest Calculator
  Loan Overpayment Calculator
 Mortgage Calculator
 Credit Card Calculator
 Investing
  Economics
 Trading
  Technical Analysis
  Personal Finance
 Calculator


