General Dynamics (GD) Fundamental and Technical Stock Analysis: Can the Defence Prime Keep Outperforming?
$364.70
04 Mar 2026, 12:54
Neutral

Join Minipip Academy and access free courses in investing, trading, economics, and more.
Sign Up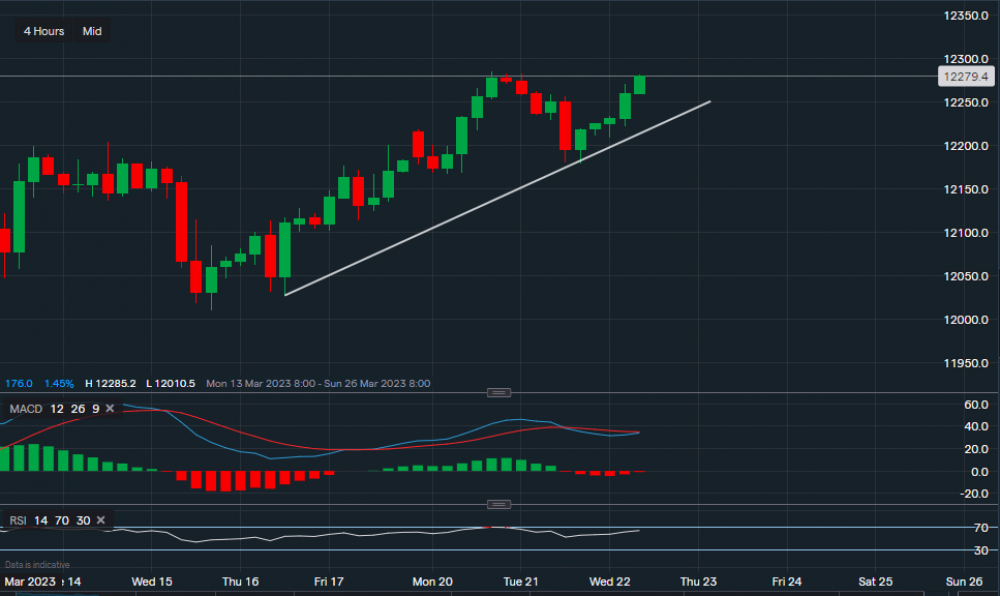
Chart & Data from IG
The pound is thriving after the release of the UK’s inflation figures. From a technical aspect, sterling is trading at around £1.2279 against the dollar with key resistance at £1.2285. A break above this point could see the forex pair head towards the £1.2350 price range. Support is established below sitting at £1.2257 then at £1.2228, which is located along the trendline. A break below the trendline would also face support at £1.2178, only a dip below this level could see the pound decline further. Potentially falling to around £1.2140. Looking at the indicators, MACD is neutral but swaying towards turning positive and RSI is positive as it reads 64.


 Earnings Calendar
  Economic Calendar
  VAT Calculator
  Tax Free Childcare Calculator
 Percentage Calculator
 Compound Interest Calculator
  Loan Overpayment Calculator
 Mortgage Calculator
 Credit Card Calculator
 Investing
  Economics
 Trading
  Technical Analysis
  Personal Finance
 Calculator


