General Dynamics (GD) Fundamental and Technical Stock Analysis: Can the Defence Prime Keep Outperforming?
$364.70
04 Mar 2026, 12:54
Neutral

Join Minipip Academy and access free courses in investing, trading, economics, and more.
Sign Up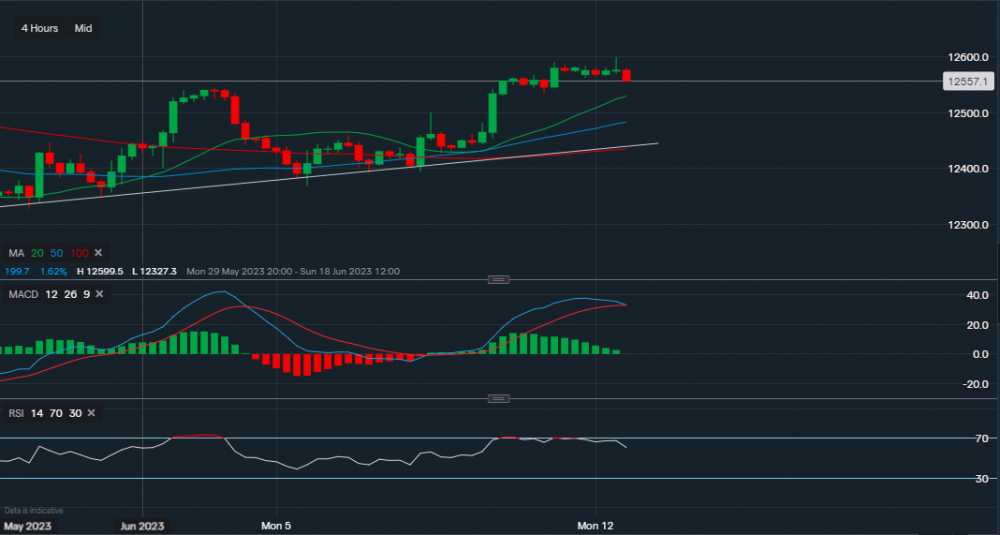
Chart & Data from IG
The pound may be undertaking a slight retracement. Currently trading at around £1.2557 against the dollar. We can see that on the 4 hourly timeframe, the price on the previous candlestick has tried to break through the resistance of £1.2590 but it has closed below it. The new candlestick has started in the red and the price has dipped below the support of £1.2563. The next support level sits along the 20-day moving average (£1.2529), a break below this level could see the pound slide further towards the support of £1.2483 (50-day MA). If sterling was to consolidate along the 20-day MA we would then look towards the upside. With resistance at £1.2544 followed by £1.2568. Looking at the technical indicators, MACD seems like its turning negative and RSI is starting to falter as it now reads 60, though still positive.

Tradable assets:
Min.Deposit:
Max Leverage:
FCA:

Rating:


 Earnings Calendar
  Economic Calendar
  VAT Calculator
  Tax Free Childcare Calculator
 Percentage Calculator
 Compound Interest Calculator
  Loan Overpayment Calculator
 Mortgage Calculator
 Credit Card Calculator
 Investing
  Economics
 Trading
  Technical Analysis
  Personal Finance
 Calculator


