General Dynamics (GD) Fundamental and Technical Stock Analysis: Can the Defence Prime Keep Outperforming?
$364.70
04 Mar 2026, 12:54
Neutral

Join Minipip Academy and access free courses in investing, trading, economics, and more.
Sign Up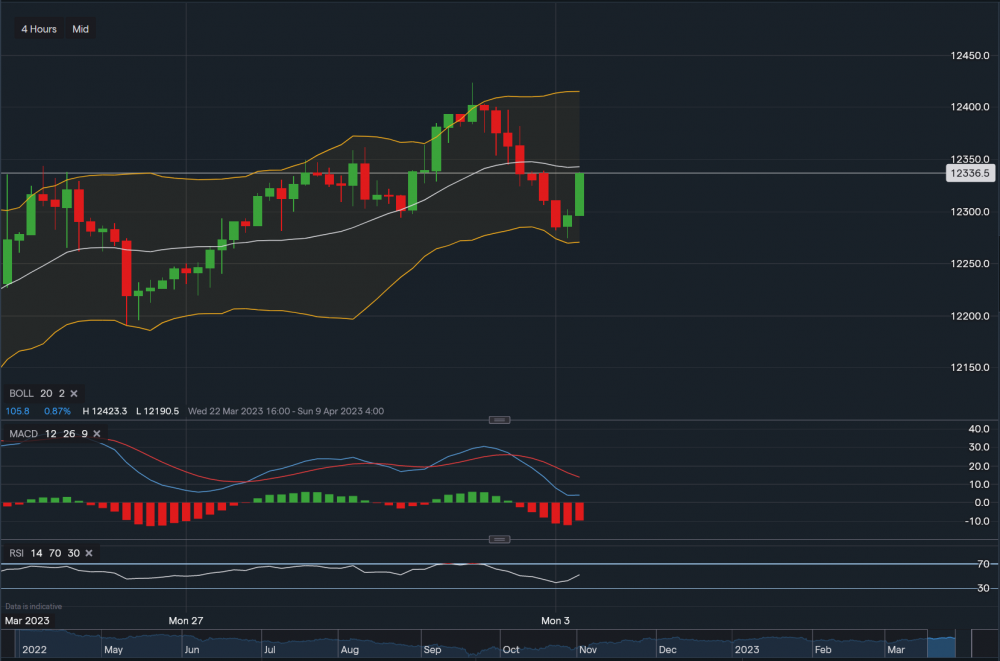
Chart & Data from IG
The pound is trading at around £1.2336 against the dollar. Taking a look at the 4-hourly timeframe in this instance, from a technical aspect we can see that it has found support at £1.2274. Just above £1.2269, which corresponds with the lower Bollinger band. A break below this support level may see its price slide lower towards the key level at £1.2190. Sterling has had a strong start in this morning’s session, now approaching the resistance sitting at £1.2343 (middle moving average of the Bollingers). A break and close above this level may see the forex pair head higher towards resistance points at £1.2361 then at £1.2393. Currently, the indicators are suggesting a neutral approach. The MACD is negative but the RSI is neutral as it reads 52 and it’s rising.


 Earnings Calendar
  Economic Calendar
  VAT Calculator
  Tax Free Childcare Calculator
 Percentage Calculator
 Compound Interest Calculator
  Loan Overpayment Calculator
 Mortgage Calculator
 Credit Card Calculator
 Investing
  Economics
 Trading
  Technical Analysis
  Personal Finance
 Calculator


