General Dynamics (GD) Fundamental and Technical Stock Analysis: Can the Defence Prime Keep Outperforming?
$364.70
04 Mar 2026, 12:54
Neutral

Join Minipip Academy and access free courses in investing, trading, economics, and more.
Sign Up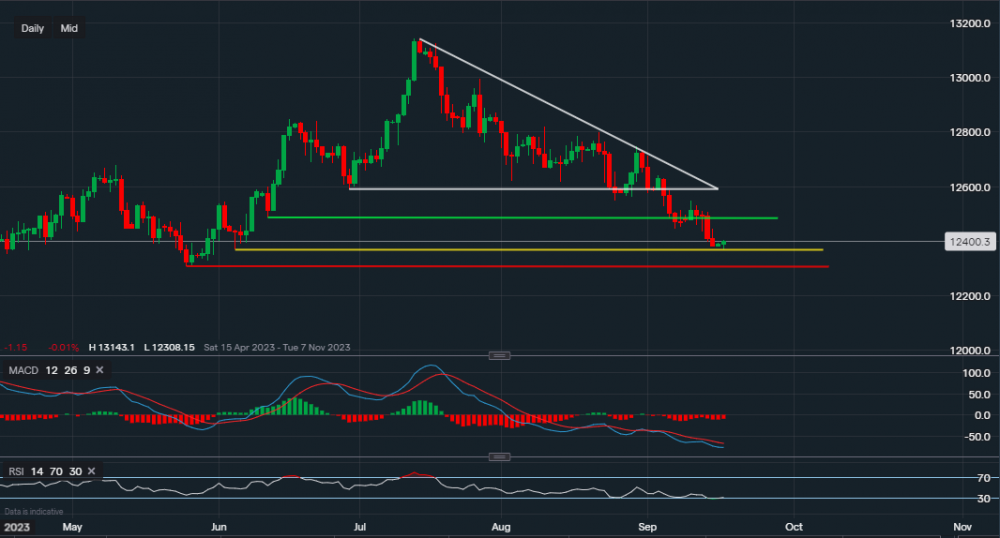
Chart & Data from IG
Taking a look at the pound versus the US dollar. Currently, the forex pair is trading at around £1.2400. On the daily interval, we can see that the pair broke through the support of £1.2487 (green trendline) and has almost tested the support of £1.2368 (yellow) earlier today. Consolidation along the yellow trendline may see a bounce higher, testing £1.2487, which is now acting as resistance. A move above it would then require a breakthrough of £1.2548 to support the view that the bearish trend has come to an end. On the other hand, a break below £1.2368 could see the pound slide lower towards the major support level along the red trendline, or respectively, £1.2308. If we take a glance at the technical indicators, they continue to suggest that the bearish trend is still at play. With the MACD extending in the negative zone and the RSI reading 31. Although, the RSI is edging closer to the oversold territory.

Tradable assets:
Min.Deposit:
Max Leverage:
FCA:

Rating:


 Earnings Calendar
  Economic Calendar
  VAT Calculator
  Tax Free Childcare Calculator
 Percentage Calculator
 Compound Interest Calculator
  Loan Overpayment Calculator
 Mortgage Calculator
 Credit Card Calculator
 Investing
  Economics
 Trading
  Technical Analysis
  Personal Finance
 Calculator


