AbbVie (ABBV) Stock Analysis: Humira Decline, New Drug Growth, and Technical Consolidation
$228.47
06 Mar 2026, 17:58
Neutral

Join Minipip Academy and access free courses in investing, trading, economics, and more.
Sign Up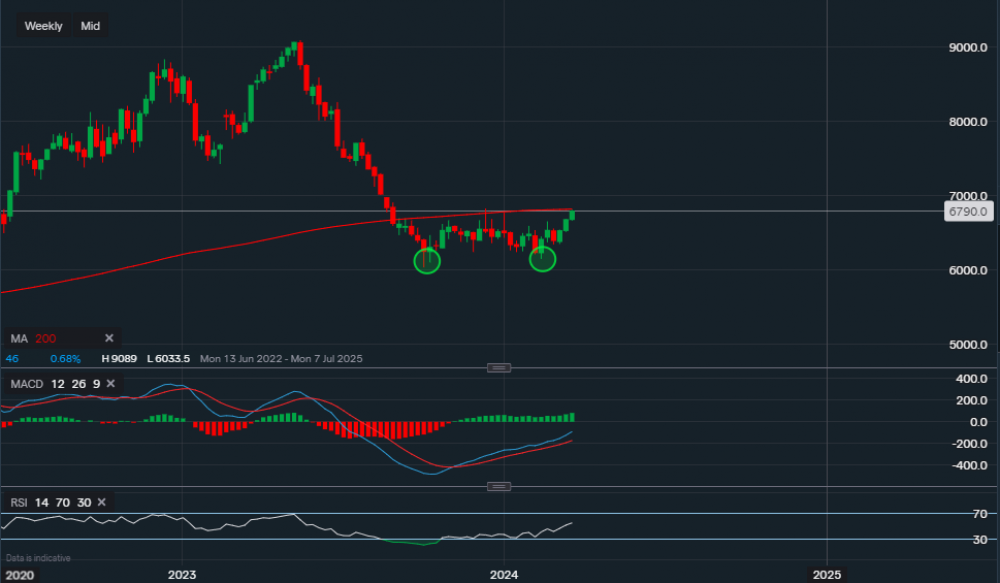
Chart & Data from IG
General Mills is expected to report its earnings on Wednesday and looking at the weekly chart it seems like it may have found a new support base. Currently, its stock is trading at around $67.90 a share, and the highlighted areas by the ovals indicate the potential new support base. In October of last year, when the stock was heavily oversold, a new support level of $60.33 was formed. Last month the price attempted to re-test this support but managed to remain above it, this may be interpreted as a bullish reversal trend. Only a break below these levels would suggest otherwise. However, GM’s share price has now approached a tough resistance point, its 200-day moving average. We can see that since October the moving average has been acting as a key resistance point, rejecting breakout attempts on two separate occasions. Yet another attempt is underway, and a positive earnings report could provide investors with a bigger incentive. A break of this 200MA followed by a close would allow investors to then eye up the area of $70-$72. The 200MA currently reads $68.18. The technical indicators look rather positive, the MACD is still on the rise and so is the RSI as it now reads 55.

Tradable assets:
Min.Deposit:
Max Leverage:
FCA:

Rating:


 Earnings Calendar
  Economic Calendar
  VAT Calculator
  Tax Free Childcare Calculator
 Percentage Calculator
 Compound Interest Calculator
  Loan Overpayment Calculator
 Mortgage Calculator
 Credit Card Calculator
 Investing
  Economics
 Trading
  Technical Analysis
  Personal Finance
 Calculator


