General Dynamics (GD) Fundamental and Technical Stock Analysis: Can the Defence Prime Keep Outperforming?
$364.70
04 Mar 2026, 12:54
Neutral

Join Minipip Academy and access free courses in investing, trading, economics, and more.
Sign Up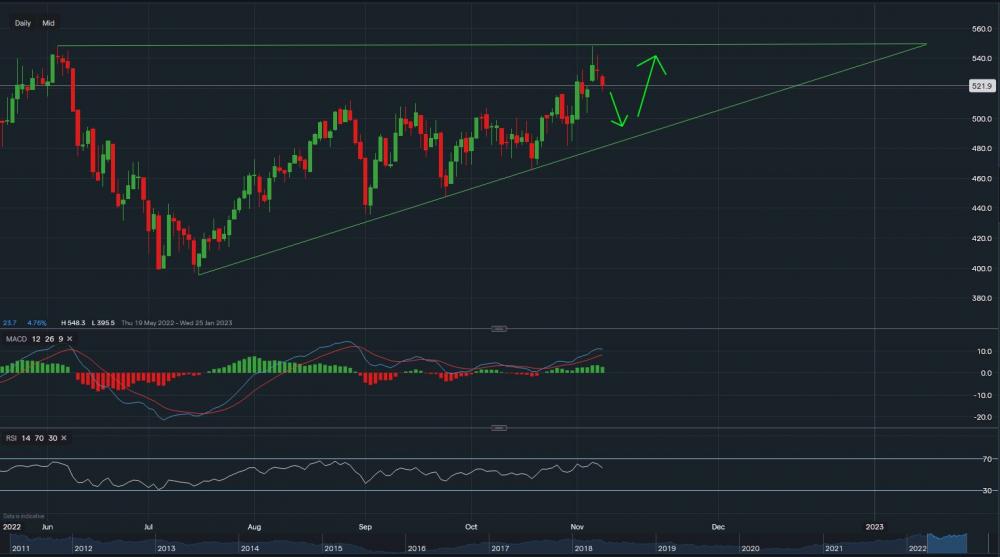
Glencore Stock - Chart & Data from IG
Glencore plc is an international commodity trading and mining company, it is one of the world’s largest globally diversified natural resource companies. Glencore is an Anglo-Swiss firm with headquarters based in Baar, Switzerland. The firm’s gas and oil head office is based in London and its registered office is in Saint Helier, Jersey. The existing company was developed through a merger between Glencore itself with Xstrata in 2013.
FinancialsLooking at the financials for the year ending 31st December 2021 versus 2020. Revenue rose to $203bn from $142bn, and as a result, in 2021 the company finished the year with a positive income than in the prior year. The income for the year 2021 totalled +$4,349bn versus (-$3,946bn) in 2020, and due to this positive income earnings per share came to +$0.38. Total assets for the year rose to $127.5bn from $118bn but so did total liabilities. Total liabilities rose to $90.5bn in 2021 against $83.5bn in 2020. However, the rise in assets offsets the rise in liabilities, therefore, bringing the total value of equity for the year to almost $37bn. A $2.5bn increase from 2020. Additionally, net cash generated by operating activities after interest and tax went up $6,196bn year-on-year.
TechnicalsFrom a technical overview, Glencore’s shares are currently trading at £5.24 a share. Towards the upside, resistance sits at £5.28 then at £5.32 then at £5.41. A move above the £5.41 price may see the stock try to break through the major resistance level at £5.48, which corresponds with the upper trendline of the symmetrical triangle. Towards the downside, support levels sit at £5.17 then at £5.12 then at £5.03. A dip below the £5.03 level could see the share price fall towards the lower trendline of the triangle, where major support sits between £4.90-£5.00. Looking at the technical indicators, MACD is currently positive and so is RSI as it reads 59.
SummaryOn the basis of the financials, the company has made significant improvements year-on-year finishing the year with a positive income, as well as stronger earnings per share compared to the previous year. The total assets overshadow the liabilities and as a result, there has been an increase in equity, and the mining company has tripled their generated net cash through operating activities. Relating to the technicals, both indicators are positive and the stock has been in an uptrend since mid-July. However, looking at the pattern within the symmetrical triangle, there is a possibility that the share price could drop lower before it bounces back higher. Though this is not guaranteed and could be influenced by many variables in the near future. Many macroeconomic factors will determine its share price, primary demand, and commodity prices. If a recession prolongs, demand will drop for commodities, and therefore prices of commodities lowering margins for the company. If you also take into consideration the historical price of Glencore right now it's trading at an 11-year high so the risk-to-reward might not be worth it just yet. A fall in price however could provide a could buying opportunity though, so it's worth watching.


 Earnings Calendar
  Economic Calendar
  VAT Calculator
  Tax Free Childcare Calculator
 Percentage Calculator
 Compound Interest Calculator
  Loan Overpayment Calculator
 Mortgage Calculator
 Credit Card Calculator
 Investing
  Economics
 Trading
  Technical Analysis
  Personal Finance
 Calculator


