General Dynamics (GD) Fundamental and Technical Stock Analysis: Can the Defence Prime Keep Outperforming?
$364.70
04 Mar 2026, 12:54
Neutral

Join Minipip Academy and access free courses in investing, trading, economics, and more.
Sign Up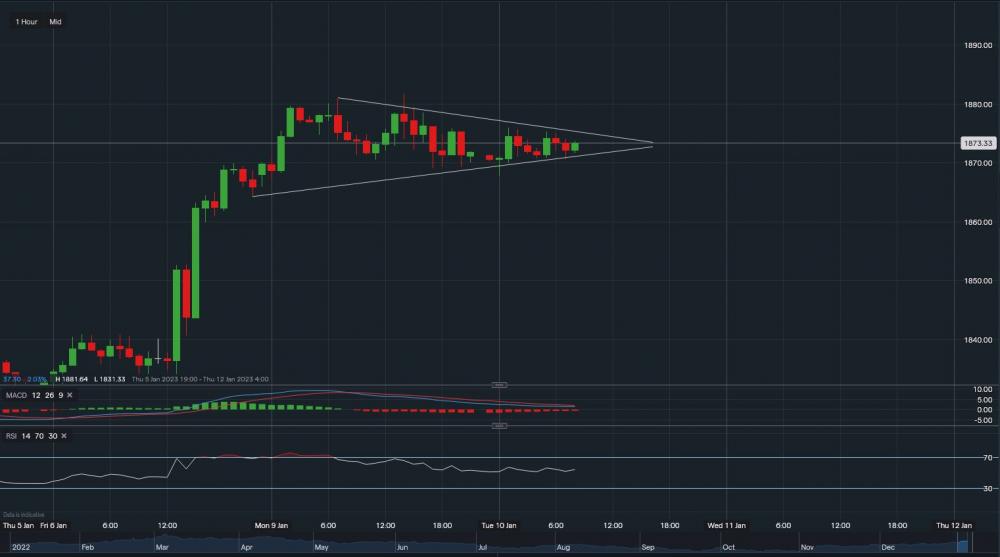
Gold - Chart & Data from IG
Gold is currently trading at around $1,873, from a technical outlook there seems to be a formation of a symmetrical triangle on the 1-hour timeframe. Towards the upside, resistance sits at $1,875, which corresponds with the upper trendline of the triangle. A break above the trendline and out of the triangle could see the price rise towards $1,880. On the other hand, towards the downside, support sits at $1,870, which in turn corresponds with the lower trendline of the triangle. A dip below this level may see the price slide towards $1,864. Looking at the technical indicators, MACD is slightly negative but turning neutral and RSI is borderline positive as it reads 55. Important to note, the bullish bias is only short-term for the time being, as Fed Chair Jerome Powell is set to speak at 14:00 GMT. This will have an influence on investor sentiment and potentially the direction of the price of Gold.


 Earnings Calendar
  Economic Calendar
  VAT Calculator
  Tax Free Childcare Calculator
 Percentage Calculator
 Compound Interest Calculator
  Loan Overpayment Calculator
 Mortgage Calculator
 Credit Card Calculator
 Investing
  Economics
 Trading
  Technical Analysis
  Personal Finance
 Calculator


