General Dynamics (GD) Fundamental and Technical Stock Analysis: Can the Defence Prime Keep Outperforming?
$364.70
04 Mar 2026, 12:54
Neutral

Join Minipip Academy and access free courses in investing, trading, economics, and more.
Sign Up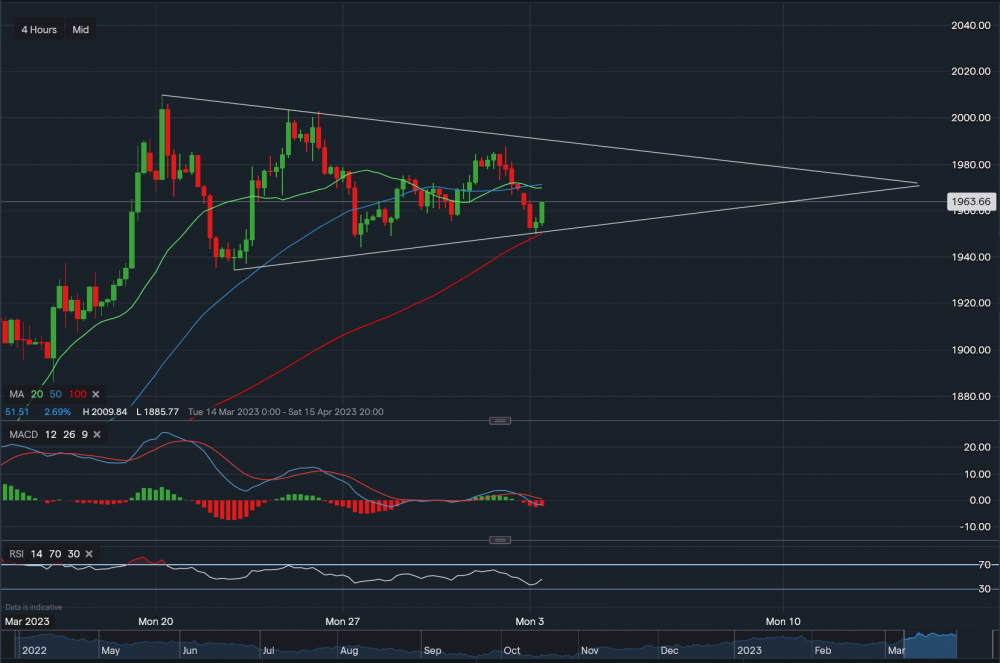
Chart & Data from IG
From a technical outlook, gold is currently trading at around $1,963 an ounce. We can see that on the 4-hourly timeframe, the commodity is creating a symmetrical triangle, and the outlook is strengthened by lower highs and higher lows. At present, resistance sits at $1,969-$1,971, which is approximately where both the 20-day and 50-day moving averages meet. A break and close above these averages may see the price of gold edge higher towards $1,987, which is the next barrier of resistance (this price level sits along the upper trendline of the triangle). On the other hand, towards the downside, support sits at $1,949 followed by $1,944 and finally at $1,934. A break below $1,934 could see the price slide further towards the range of $1,885-$1,900 an ounce. Looking at the technical indicators, MACD is negative but RSI is neutral as it reads 46. Investors should be aware that the recent jump in oil prices could play a role in the direction of gold. Crude prices are used as a measurable indicator of the status of the global economy, hence, higher crude prices could mean inflation will remain high. In turn, high inflation would result in interest rates remaining at their current level or potentially even further smaller increases. This would not only have an impact on equities but also on gold.


 Earnings Calendar
  Economic Calendar
  VAT Calculator
  Tax Free Childcare Calculator
 Percentage Calculator
 Compound Interest Calculator
  Loan Overpayment Calculator
 Mortgage Calculator
 Credit Card Calculator
 Investing
  Economics
 Trading
  Technical Analysis
  Personal Finance
 Calculator


