General Dynamics (GD) Fundamental and Technical Stock Analysis: Can the Defence Prime Keep Outperforming?
$364.70
04 Mar 2026, 12:54
Neutral

Join Minipip Academy and access free courses in investing, trading, economics, and more.
Sign Up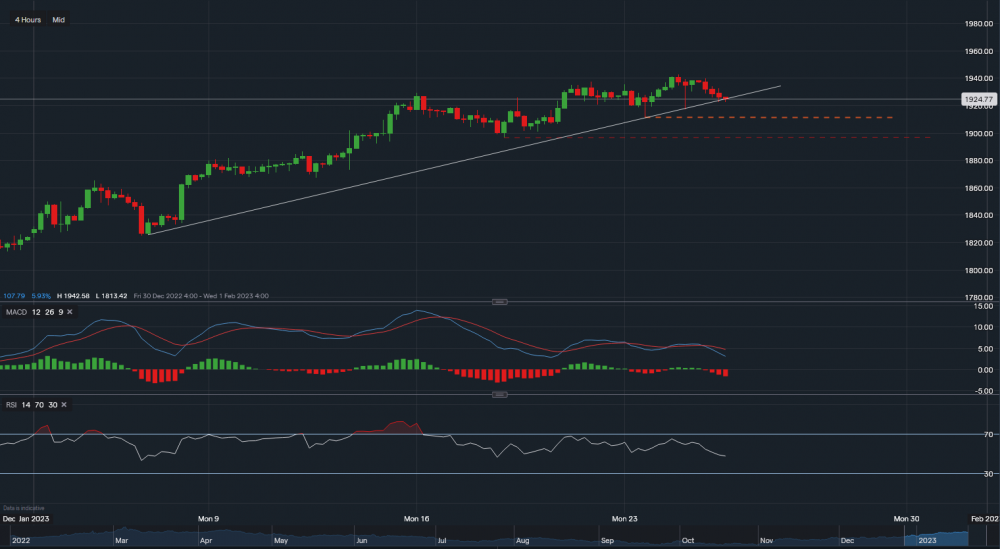
Gold - Chart & Data from IG
Gold has approached the support trendline on the 4 hourly timeframe. Currently trading around $1,924, a break below would test the support levels sitting at $1,911 (orange trendline) and then at $1,896 (red trendline). However, as investors are turning to gold for 'safety' due to the current market conditions, the pattern of dipping before bouncing higher is still yet to play out. Therefore, resistance above sits at $1,929 then at $1,935 then a key level at $1,942. A break above $1,942 could see the price of gold climb towards the $1,955-$1,960 price range. Looking at the technical indicators, MACD is currently negative but RSI is neutral as it reads 49.


 Earnings Calendar
  Economic Calendar
  VAT Calculator
  Tax Free Childcare Calculator
 Percentage Calculator
 Compound Interest Calculator
  Loan Overpayment Calculator
 Mortgage Calculator
 Credit Card Calculator
 Investing
  Economics
 Trading
  Technical Analysis
  Personal Finance
 Calculator


