NASDAQ Outlook: Is a Bullish Rally Taking Shape?
$256.43
07 Jan 2026, 00:38

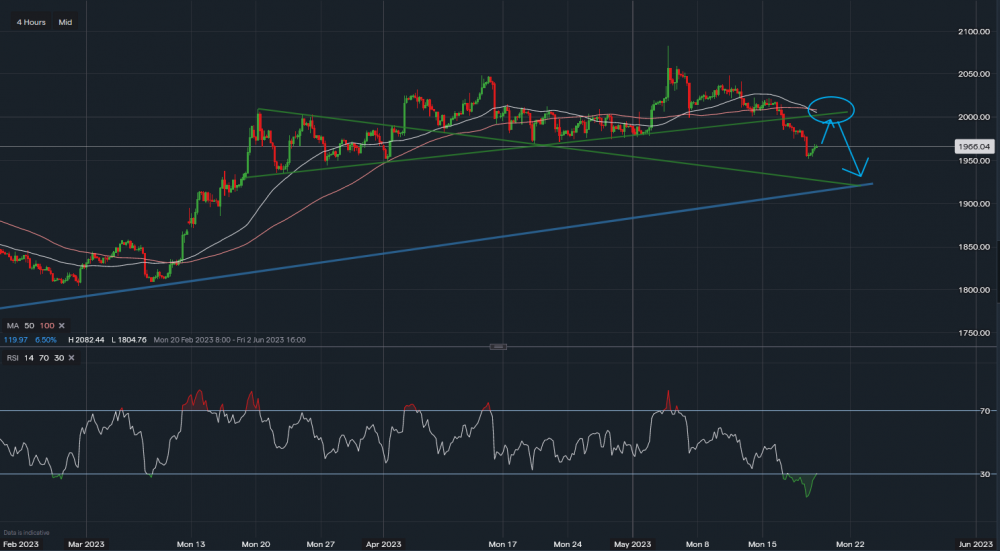
Gold - Chart & Data from IG

Gold has fallen over 3% this week as the DXY rallied higher. Our full review can be found here. Looking at the 4-hourly timeframe, gold looks to possibly bounce towards $2000 where the 50 & 100 SMA sits. There is also further resistance from previous support dating back to the 17th of March. RSI was oversold, however, has now come out of this level to read 31. Until $2000 breaks gold remains neutral at this point providing no real opportunity either to the downside or upside however the arrows would denote how we believe this could move.