AbbVie (ABBV) Stock Analysis: Humira Decline, New Drug Growth, and Technical Consolidation
$228.47
06 Mar 2026, 17:58
Neutral

Join Minipip Academy and access free courses in investing, trading, economics, and more.
Sign Up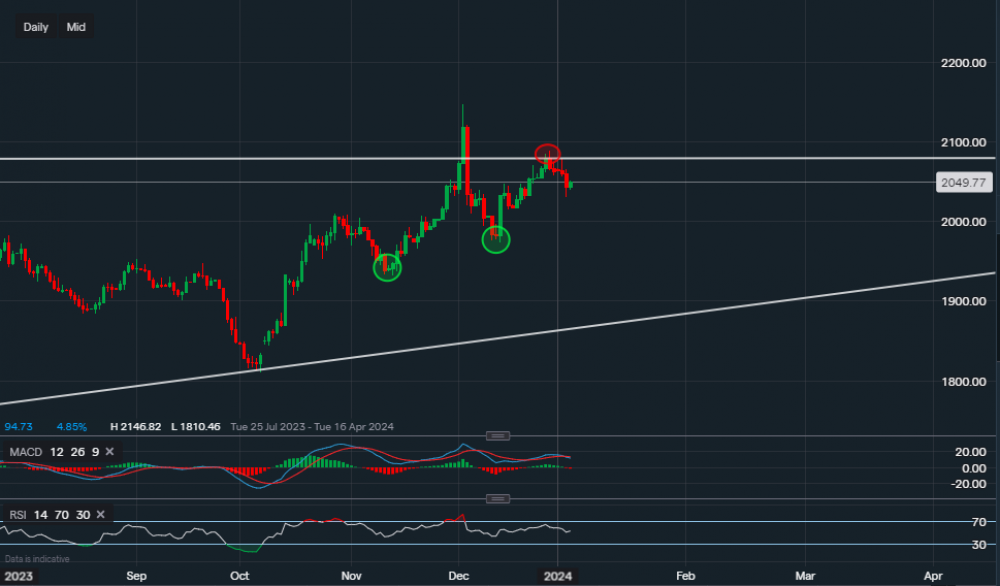
Chart & Data from IG
Gold is struggling to overcome the resistance of $2,075 as highlighted by the red oval. Currently, the commodity is trading at around $2,049 an ounce. The support here now is yesterday’s low of $2,030, a break below this price level would then shift the focus to $2,016. A move below $2,106 would not necessarily mean that the bulls would be on the back foot as the previous key support levels of $1,973 and $1,931 are still in order as well (green ovals). On the other hand, towards the upside, if gold manages to break above the resistance of $2,075 then the next target for the bulls would be the all-time high of $2,146. The technical indicators on the daily interval are a little mixed right now, not offering much clarity. The MACD has just turned slightly negative but the RSI is neutral/flat as it reads 53.

Tradable assets:
Min.Deposit:
Max Leverage:
FCA:

Rating:


 Earnings Calendar
  Economic Calendar
  VAT Calculator
  Tax Free Childcare Calculator
 Percentage Calculator
 Compound Interest Calculator
  Loan Overpayment Calculator
 Mortgage Calculator
 Credit Card Calculator
 Investing
  Economics
 Trading
  Technical Analysis
  Personal Finance
 Calculator


