General Dynamics (GD) Fundamental and Technical Stock Analysis: Can the Defence Prime Keep Outperforming?
$364.70
04 Mar 2026, 12:54
Neutral

Join Minipip Academy and access free courses in investing, trading, economics, and more.
Sign Up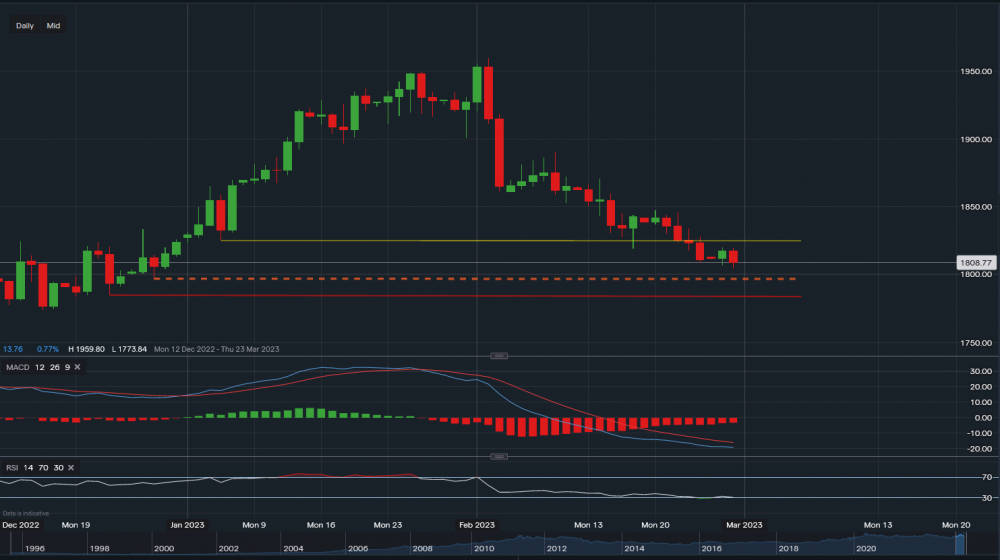
Gold - Chart & Data from IG
Gold now heading towards the orange support trendline, we can see that on Thursday 23rd of February it moved and closed below the yellow trendline, breaking through that support barrier. Now the next key support level sits at $1,797 (along the orange trendline). A break and close below $1,797 could see the price fall as low as $1,784 (further support along the red trendline). A break below the red may even see a fall towards $1,750, although if this was to occur, it is more likely in the mid-term. Towards the upside, previous support of $1,825 is now acting as key resistance. However, it would need to tackle the first resistance level at $1,820. A break and close above the yellow trendline could maybe see a formation of some consolidation within its price. The technical indicators are both strongly negative, although the volume of MACD is starting to lower and RSI reads 30, suggesting the commodity is borderline ‘oversold’.


 Earnings Calendar
  Economic Calendar
  VAT Calculator
  Tax Free Childcare Calculator
 Percentage Calculator
 Compound Interest Calculator
  Loan Overpayment Calculator
 Mortgage Calculator
 Credit Card Calculator
 Investing
  Economics
 Trading
  Technical Analysis
  Personal Finance
 Calculator


