General Dynamics (GD) Fundamental and Technical Stock Analysis: Can the Defence Prime Keep Outperforming?
$364.70
04 Mar 2026, 12:54
Neutral

Join Minipip Academy and access free courses in investing, trading, economics, and more.
Sign Up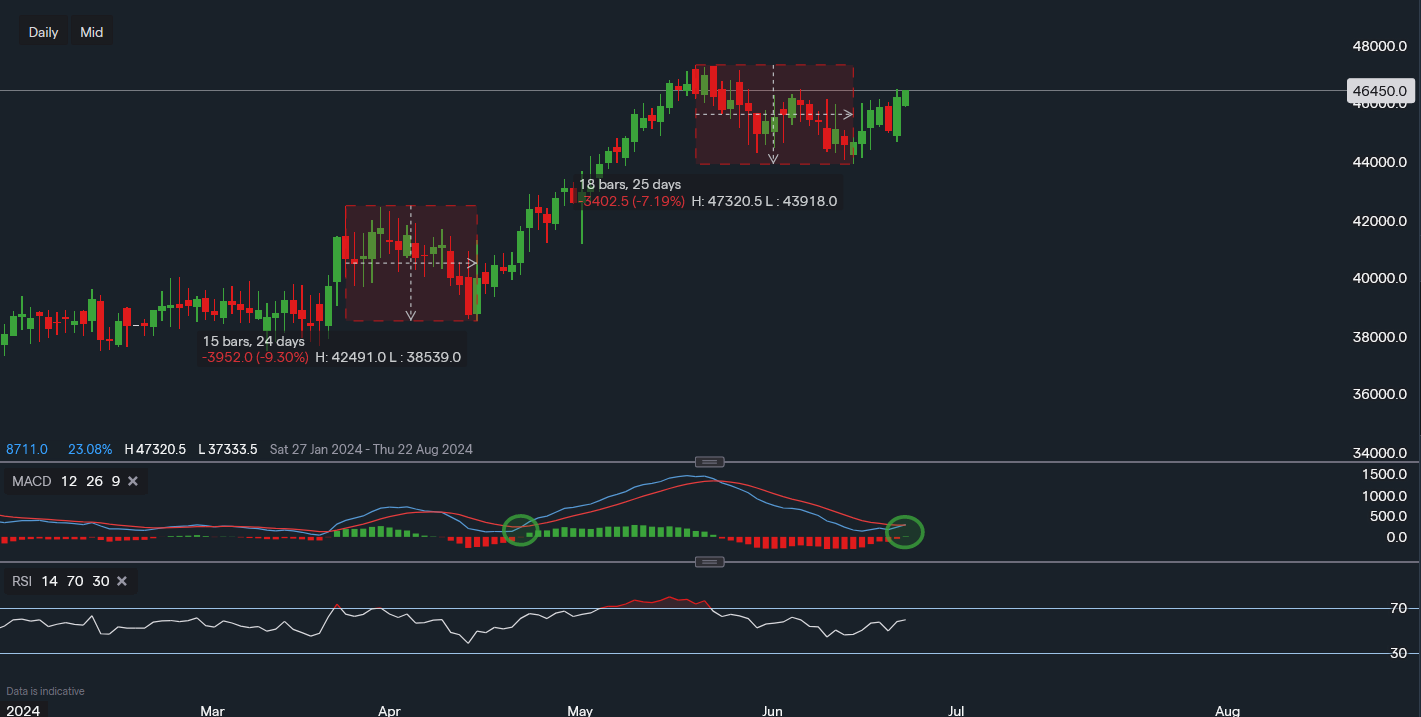
Chart & Data from IG
Taking a look at Goldman Sachs it seems like the consolidation phase after the minor pullback may now be over, Currently, its stock is trading at around $464.50 a share in the pre-market trade. The daily chart is demonstrating a potential setup for another push higher here for the financial bank. The pullback lasted approximately the same amount of time as the one in April, with a similar drawdown percentage. The support is established at $439.18 and a break below it could lead to a further sell-off, as it would indicate that momentum has faded. In that scenario, investors could turn to the area of $410-$420 looking for support. Towards the upside, the resistance in the spotlight is the price level of $465.08. A move above this level would increase the likelihood of an extension towards the previous high of $473.20. Looking at the technical indicators, they certainly are lined up for a push higher. The MACD seems to be turning positive, just as it had done back in April. The RSI has also now turned positive as it reads 55.

Tradable assets:
Min.Deposit:
Max Leverage:
FCA:

Rating:


 Earnings Calendar
  Economic Calendar
  VAT Calculator
  Tax Free Childcare Calculator
 Percentage Calculator
 Compound Interest Calculator
  Loan Overpayment Calculator
 Mortgage Calculator
 Credit Card Calculator
 Investing
  Economics
 Trading
  Technical Analysis
  Personal Finance
 Calculator


