General Dynamics (GD) Fundamental and Technical Stock Analysis: Can the Defence Prime Keep Outperforming?
$364.70
04 Mar 2026, 12:54
Neutral

Join Minipip Academy and access free courses in investing, trading, economics, and more.
Sign Up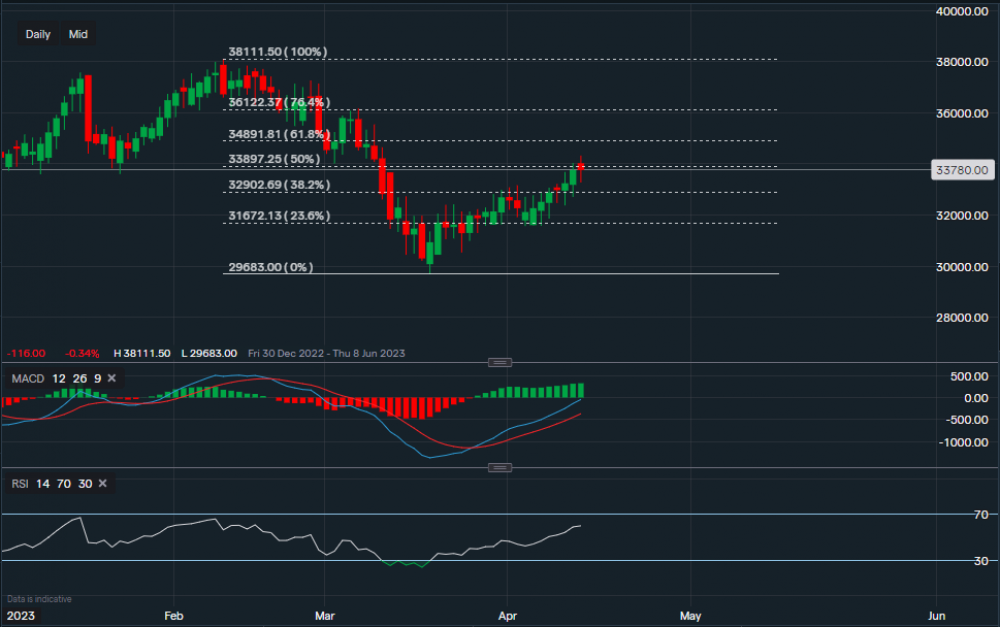
Chart & Data from IG
Taking a look at Goldman Sachs on the daily interval. Its stock price currently sits at around $337.80 a share. Applying the Fibonacci retracement to the chart, we can see its price has managed to break through the 23.6% and 38.2% Fib levels. It has tried to break through the 50% level but failed to close above it. At present, the support sits at $329.02 (38.2% fib) then a base at $316.72 (23.6%). Only a break and close below the 23.6% fib could see the price retreat lower towards the major support level at $296.83. Towards the upside, the key resistance remains at $338.97 (50% fib). A break and close above may see the price hike further, with the next target then of $348.91 (61.8% fib). The indicators are both positive, with RSI reading of 57. The bank is due to report earnings tomorrow, it is estimated to report an EPS of $8.24 on revenue of $12.83bn.


 Earnings Calendar
  Economic Calendar
  VAT Calculator
  Tax Free Childcare Calculator
 Percentage Calculator
 Compound Interest Calculator
  Loan Overpayment Calculator
 Mortgage Calculator
 Credit Card Calculator
 Investing
  Economics
 Trading
  Technical Analysis
  Personal Finance
 Calculator


