General Dynamics (GD) Fundamental and Technical Stock Analysis: Can the Defence Prime Keep Outperforming?
$364.70
04 Mar 2026, 12:54
Neutral

Join Minipip Academy and access free courses in investing, trading, economics, and more.
Sign Up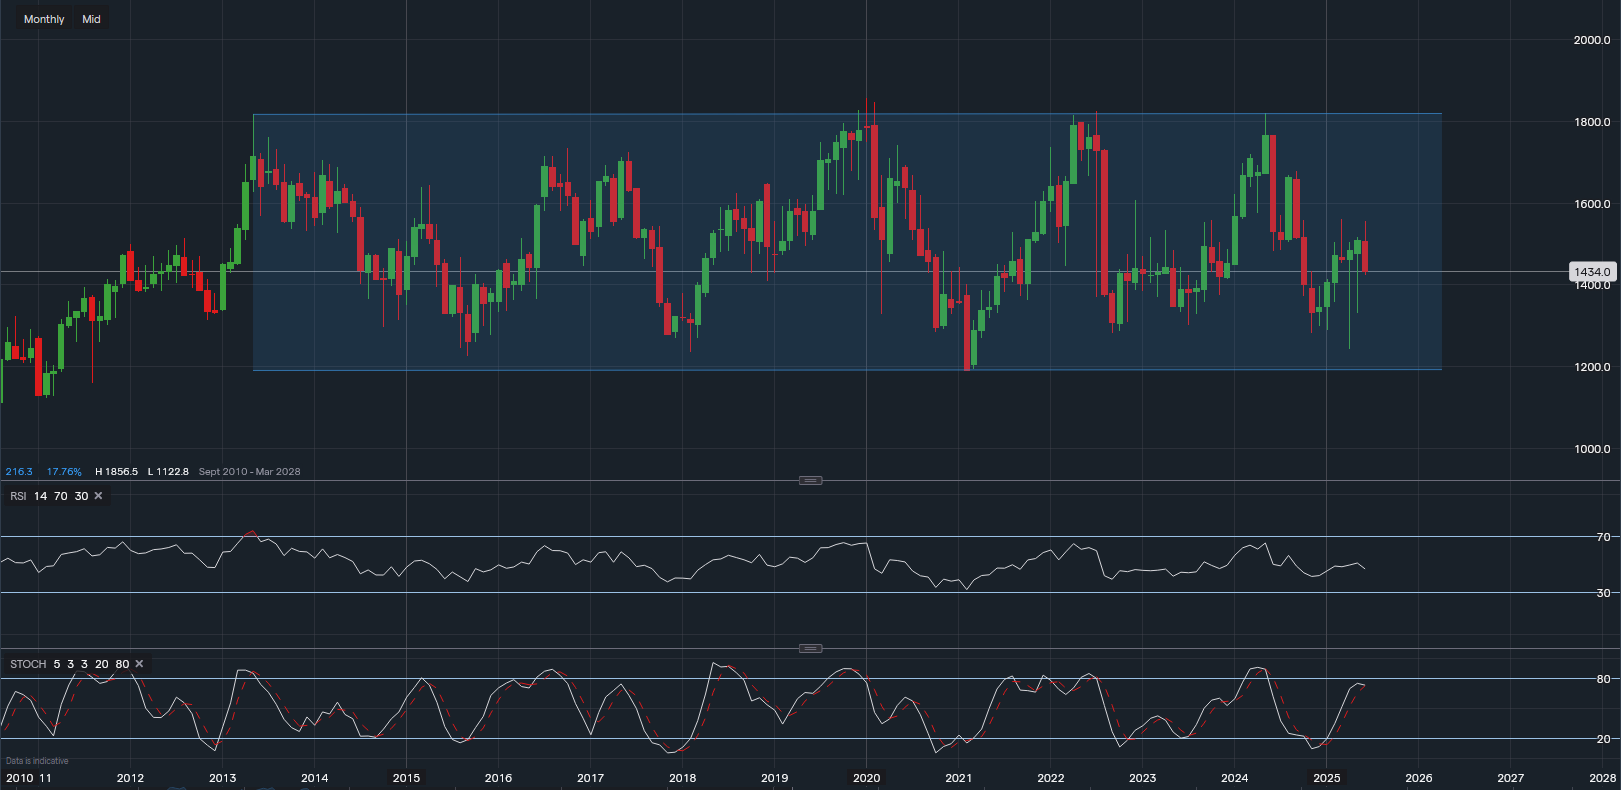
Chart & Data from IG
GSK plc is currently trading in a rangebound pattern on the monthly chart, with price action stuck in a neutral zone. This lack of clear direction is making it difficult for traders to assess the near-to-medium-term trend, as momentum appears indecisive.
At the close of today’s session, GSK shares finished at 1434p, representing a modest gain of around 6% year-to-date. However, with June shaping up to be a negative month, technical indicators are beginning to turn bearish, raising concerns of potential downside pressure heading into the summer months.
The Relative Strength Index (RSI) has begun to curl lower, while the stochastic oscillator is also rolling over after approaching overbought territory. This weakening momentum could trigger further selling activity, as bearish traders look to open short positions and cautious investors seek to diversify their portfolios elsewhere.
From a technical analysis perspective, the risk-to-reward ratio at current levels appears highly neutral, offering little edge for directional trades. More favourable opportunities may present themselves at either end of the long-term channel:
Potential long entry: Around 1200p to 1250p, near the bottom of the channel
Potential short entry: Around 1800p, near the upper resistance zone
Until GSK breaks out of its current range or provides clearer signals through momentum indicators, traders and investors are advised to remain cautious and avoid taking large directional positions.

Tradable assets:
Min.Deposit:
Max Leverage:
FCA:

Rating:


 Earnings Calendar
  Economic Calendar
  VAT Calculator
  Tax Free Childcare Calculator
 Percentage Calculator
 Compound Interest Calculator
  Loan Overpayment Calculator
 Mortgage Calculator
 Credit Card Calculator
 Investing
  Economics
 Trading
  Technical Analysis
  Personal Finance
 Calculator


