General Dynamics (GD) Fundamental and Technical Stock Analysis: Can the Defence Prime Keep Outperforming?
$364.70
04 Mar 2026, 12:54
Neutral

Join Minipip Academy and access free courses in investing, trading, economics, and more.
Sign Up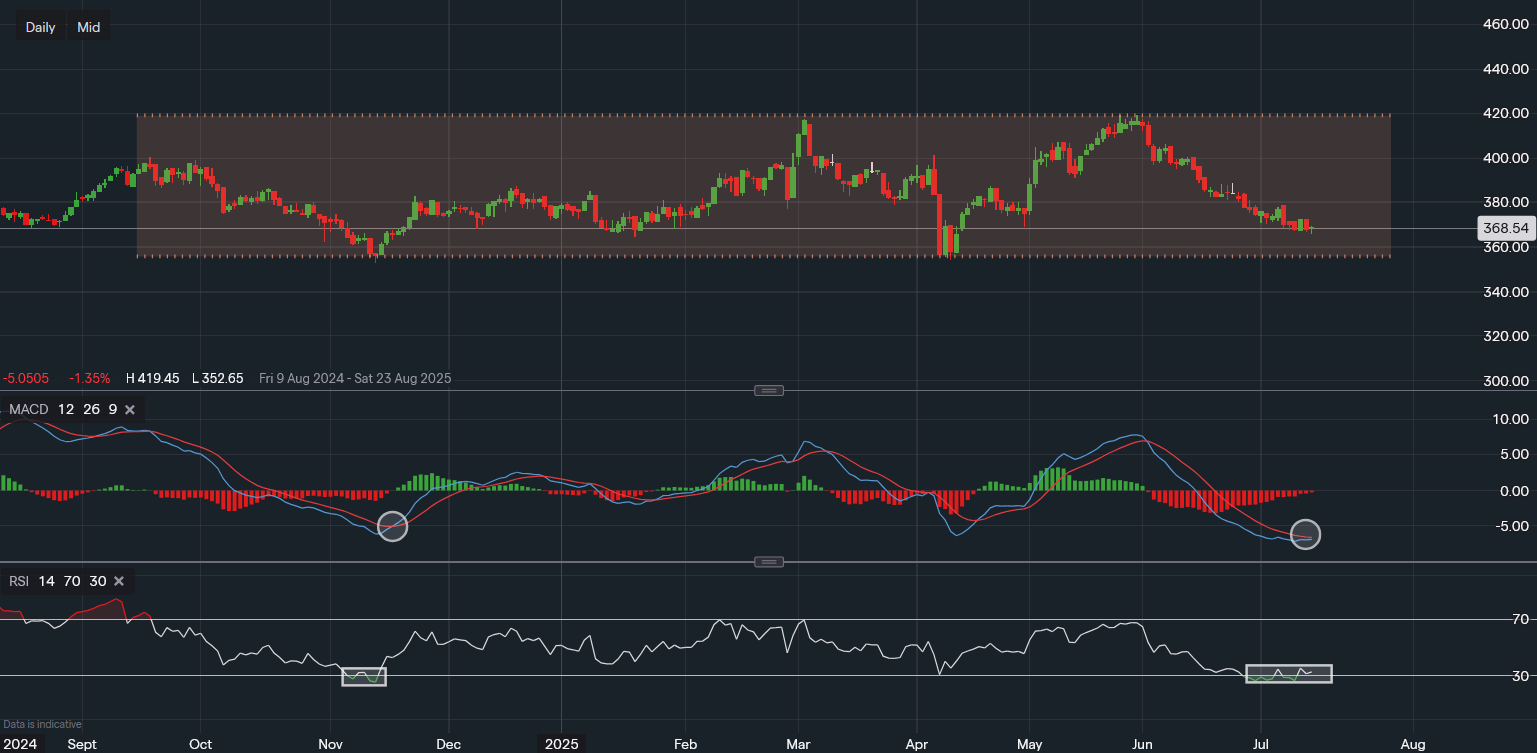
Chart & Data from IG
Pros – Improvements in 2024 vs. 2023
Cons – Areas of Concern for 2024 and Going Forward
Outlook for the Next 6 Months
Opportunities:
Risks:
Haleon PLC's share price has recently approached the lower boundary of its long-standing trading channel, which it has remained within for the past 10 months. Currently trading around 368p per share, the stock has experienced a notable pullback from the upper trendline resistance. This price action suggests that bearish momentum may be fading, with signs emerging of a potential neutral to bullish reversal in the near term.
Several key technical indicators are aligning to support this changing outlook:
MACD Turning Bullish: On the daily timeframe, the MACD (Moving Average Convergence Divergence) is showing early signs of a bullish crossover, the first time this signal has appeared since late May.
RSI Near Oversold: The Relative Strength Index (RSI) has been either oversold or hovering near oversold territory over recent weeks, indicating that the stock may be primed for a bounce if buying pressure increases.
Interestingly, the current chart setup resembles the scenario observed back in November 2023, when Haleon’s share price rebounded sharply from similar technical conditions, gaining approximately 9%. While there is no guarantee of a repeat performance, the resemblance suggests that a short-term rally could be on the cards.
In summary, Haleon PLC stock is trading near a key support level within its established price channel. With technical indicators pointing towards a shift in momentum and historical patterns supporting the case for a bullish reversal, traders and investors may want to keep a close eye on this stock in the coming days.
If buyers step in at these levels, Haleon’s share price could see a potential bounce, offering short-term trading opportunities as market sentiment improves.
(Sources: yahoofinance.com)

Tradable assets:
Min.Deposit:
Max Leverage:
FCA:

Rating:


 Earnings Calendar
  Economic Calendar
  VAT Calculator
  Tax Free Childcare Calculator
 Percentage Calculator
 Compound Interest Calculator
  Loan Overpayment Calculator
 Mortgage Calculator
 Credit Card Calculator
 Investing
  Economics
 Trading
  Technical Analysis
  Personal Finance
 Calculator


