General Dynamics (GD) Fundamental and Technical Stock Analysis: Can the Defence Prime Keep Outperforming?
$364.70
04 Mar 2026, 12:54
Neutral

Join Minipip Academy and access free courses in investing, trading, economics, and more.
Sign Up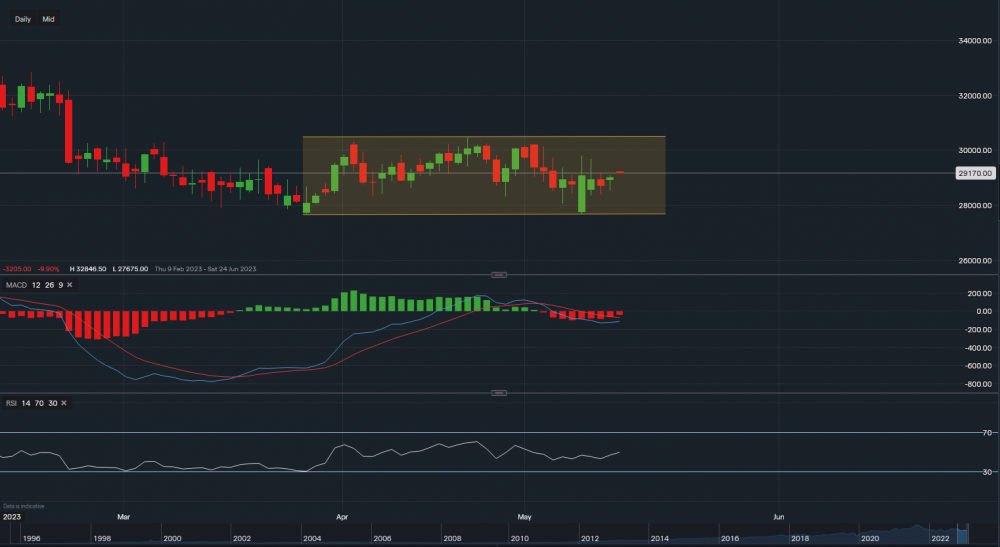
Chart & Data from IG
Taking a look at the American giant Home Depot as the home retailer is scheduled to report its quarterly earnings tomorrow. Its stock is currently trading at around $291.70 a share. Looking at the daily interval, we can see that pretty much since the back end of March and all of April, its shares price has been stuck within this channel drawn on the chart. With the support sitting at $283.25 followed by a key level resting at $276.75 (lower trendline of the channel). A break below the key support level could see the price head as low as $266 a share. On the other hand, if the company reports a positive earnings report with an appealing outlook for the rest of the year, then investors may see the price test the resistance levels above. Resistance sits at $296.79 then at $303.01, and the key level at $304.85 (upper trendline of the channel). A break above $304.85 may see the price edge higher towards $310-$315 a share. Looking at the indicators, MACD remains negative at the moment but the RSI is neutral and rising as it now reads 50.

Tradable assets:
Min.Deposit:
Max Leverage:
FCA:

Rating:


 Earnings Calendar
  Economic Calendar
  VAT Calculator
  Tax Free Childcare Calculator
 Percentage Calculator
 Compound Interest Calculator
  Loan Overpayment Calculator
 Mortgage Calculator
 Credit Card Calculator
 Investing
  Economics
 Trading
  Technical Analysis
  Personal Finance
 Calculator


