General Dynamics (GD) Fundamental and Technical Stock Analysis: Can the Defence Prime Keep Outperforming?
$364.70
04 Mar 2026, 12:54
Neutral

Join Minipip Academy and access free courses in investing, trading, economics, and more.
Sign Up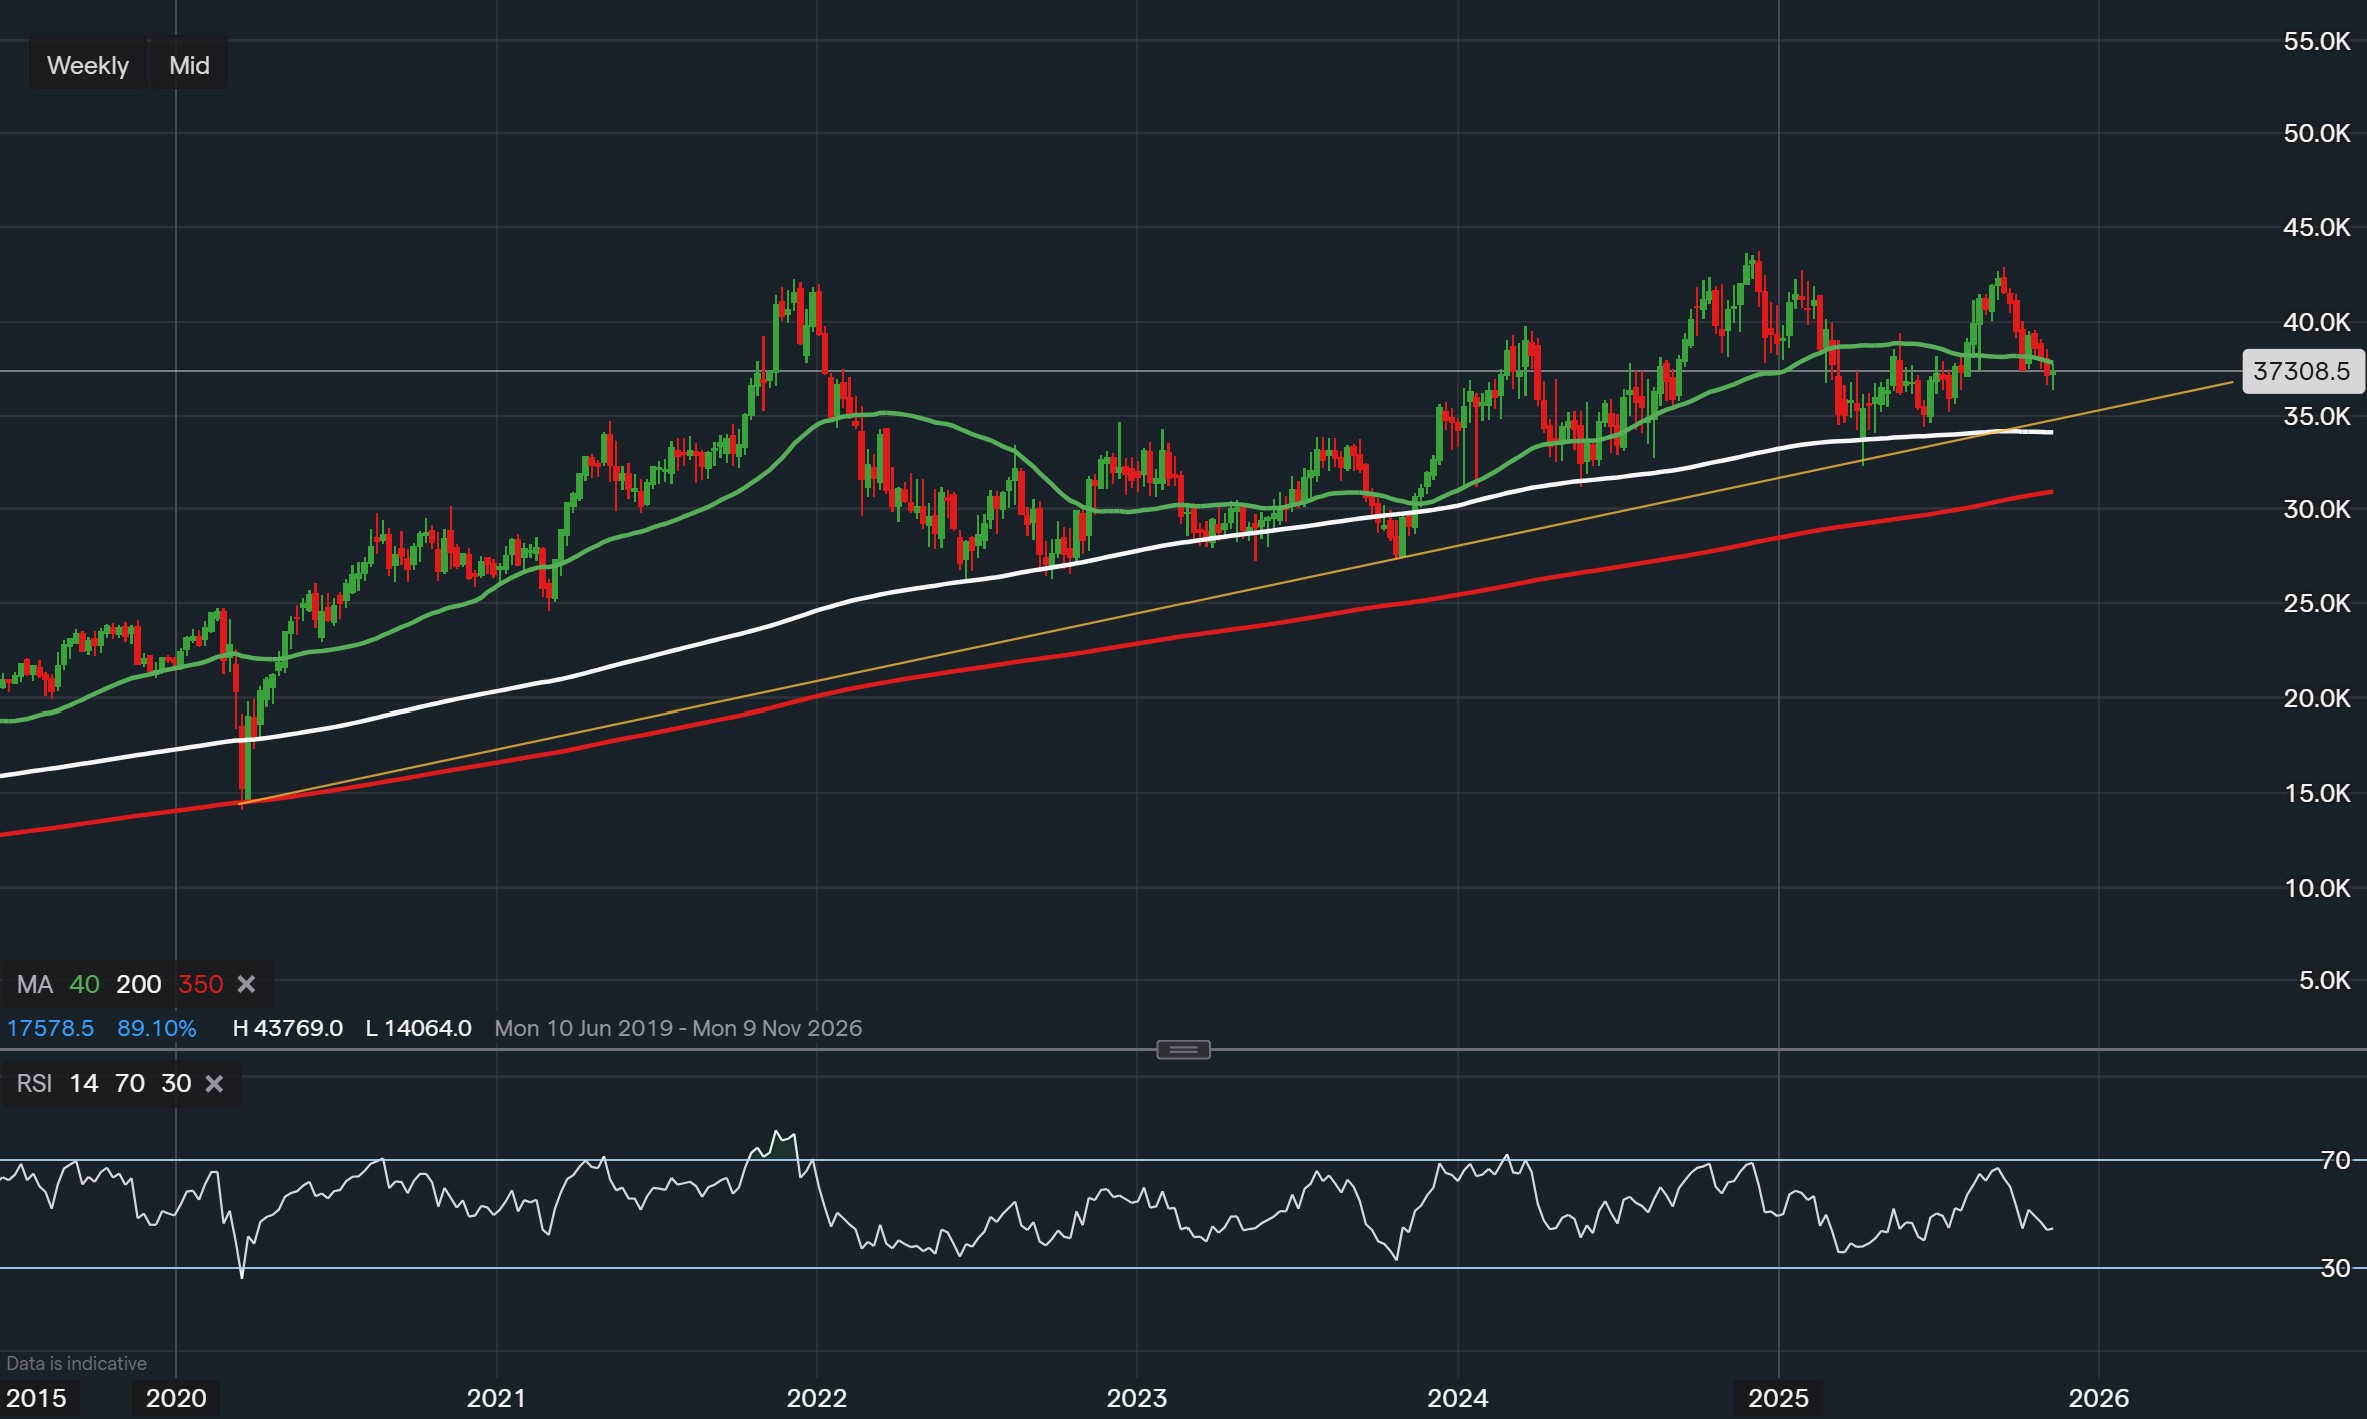
Data from IG - Timeframe - Weekly
Overview
Home Depot currently trades at a price-to-earnings ratio of 25.34, suggesting investors are paying $25.34 for every $1 of earnings. This stands slightly above the sector average, reflecting steady confidence in the company’s performance and stability. The forward P/E ratio of 23 points toward expectations of moderate earnings growth over the next twelve months, supporting a consistent profitability outlook and long-term investor confidence.
Technical Structure
From a technical perspective, the share price is positioned near its 40-day moving average, indicating short-term hesitation in market direction. The 200-day moving average, located close to $360, serves as an important measure of medium-term support, while the 350-day moving average continues to reinforce the long-term positive structure, showing resilience despite short-term fluctuations.
 Data from IG - Timeframe - Daily
Chart Patterns and Momentum
On the daily timeframe, a head and shoulders formation has developed within key Fibonacci retracement zones, pointing to possible short-term weakness before the longer-term trend resumes. This setup aligns with potential movement toward the $347 area, which could act as a key region of interest. The Relative Strength Index (RSI) recently fell below oversold territory but is now showing signs of strengthening, suggesting improving short-term sentiment and a gradual recovery in momentum.
Market Sentiment
Overall sentiment around Home Depot remains cautiously positive. The company’s profitability and operational consistency continue to be well-regarded, although broader housing market pressures and consumer spending patterns contribute to a measured tone among analysts. According to TipRanks, 26 analysts currently cover the stock, with the majority maintaining a strong buy rating reflecting confidence in Home Depot’s longer-term growth prospects and stability.
Scenario Outlook
Market dynamics currently suggest a balanced outlook. Should the price establish strength above the $380 level, it may indicate renewed bullish momentum, potentially allowing a move toward $405 and possibly higher if momentum persists. In contrast, continued weakness below $360 could see the stock drift toward $350, with the 350-day moving average near $332 acting as a broader trend reference point.
Summary
Home Depot continues to demonstrate long-term resilience, supported by stable earnings expectations and a solid valuation profile. Technical readings place the stock in a neutral zone balanced between short-term consolidation and underlying long-term strength. The $360 level remains a key technical reference, marking the threshold between sustained trend stability and a potential corrective phase.
Disclaimer
This analysis is intended solely for educational and informational purposes. It does not constitute financial advice, investment guidance, or trading recommendations. Market conditions can change rapidly, and all investment decisions should be made based on individual research.

Tradable assets:
Min.Deposit:
Max Leverage:
FCA:

Rating:


 Earnings Calendar
  Economic Calendar
  VAT Calculator
  Tax Free Childcare Calculator
 Percentage Calculator
 Compound Interest Calculator
  Loan Overpayment Calculator
 Mortgage Calculator
 Credit Card Calculator
 Investing
  Economics
 Trading
  Technical Analysis
  Personal Finance
 Calculator


