General Dynamics (GD) Fundamental and Technical Stock Analysis: Can the Defence Prime Keep Outperforming?
$364.70
04 Mar 2026, 12:54
Neutral

Join Minipip Academy and access free courses in investing, trading, economics, and more.
Sign Up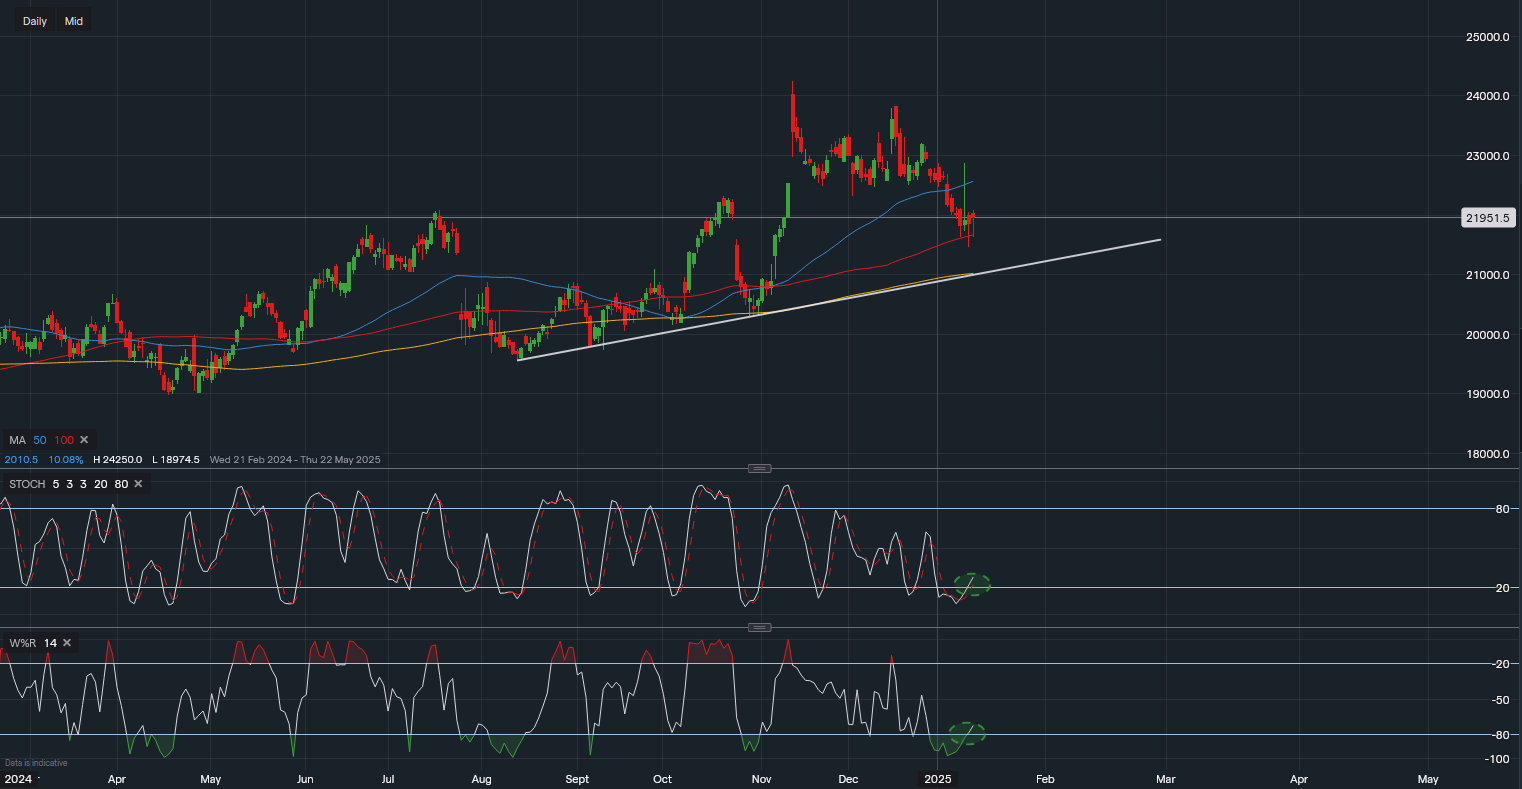
Chart & Data from IG
Honeywell's share price has recently retraced approximately 8.6% since its breakout attempt in mid-November. This decline has caught the attention of investors, especially as the stock approaches key technical levels that could influence future price movements.
On the daily chart, the past two trading sessions have displayed hammer doji candlesticks, typically indicative of potential reversals. However, both doji candlesticks have closed lower than their opening prices, signalling continued weakness despite some buying interest.
Currently, Honeywell's share price is testing support at the 100-day moving average (100MA). This critical level appears to have encouraged buyers to step in, possibly due to two key technical indicators:
The combination of these factors may lead to a short-term rebound in Honeywell's share price. A potential target for such a recovery is $225 per share, where the 50-day moving average (50MA) is located. Historically, this level acted as a strong support zone in November and December, but it may now serve as resistance.
With the current price at $219.51 per share, a rise to $225 would represent a 2.5% gain. However, traders should be cautious of a potential breakdown below the 100MA, which could lead to further declines.
If the 100MA fails to hold, Honeywell's share price may slide towards the supportive trendline (white), which aligns closely with the 200-day moving average (200MA) around $210 per share. This level is likely to attract significant buying interest, as it represents a critical long-term support zone.
A drop to $210 would equate to a 4% decline from the current price, offering a potential buying opportunity for investors targeting a medium- to long-term recovery.
Investors should keep an eye on these technical levels and indicators to gauge Honeywell’s next price movements.

Tradable assets:
Min.Deposit:
Max Leverage:
FCA:

Rating:


 Earnings Calendar
  Economic Calendar
  VAT Calculator
  Tax Free Childcare Calculator
 Percentage Calculator
 Compound Interest Calculator
  Loan Overpayment Calculator
 Mortgage Calculator
 Credit Card Calculator
 Investing
  Economics
 Trading
  Technical Analysis
  Personal Finance
 Calculator


