General Dynamics (GD) Fundamental and Technical Stock Analysis: Can the Defence Prime Keep Outperforming?
$364.70
04 Mar 2026, 12:54
Neutral

Join Minipip Academy and access free courses in investing, trading, economics, and more.
Sign Up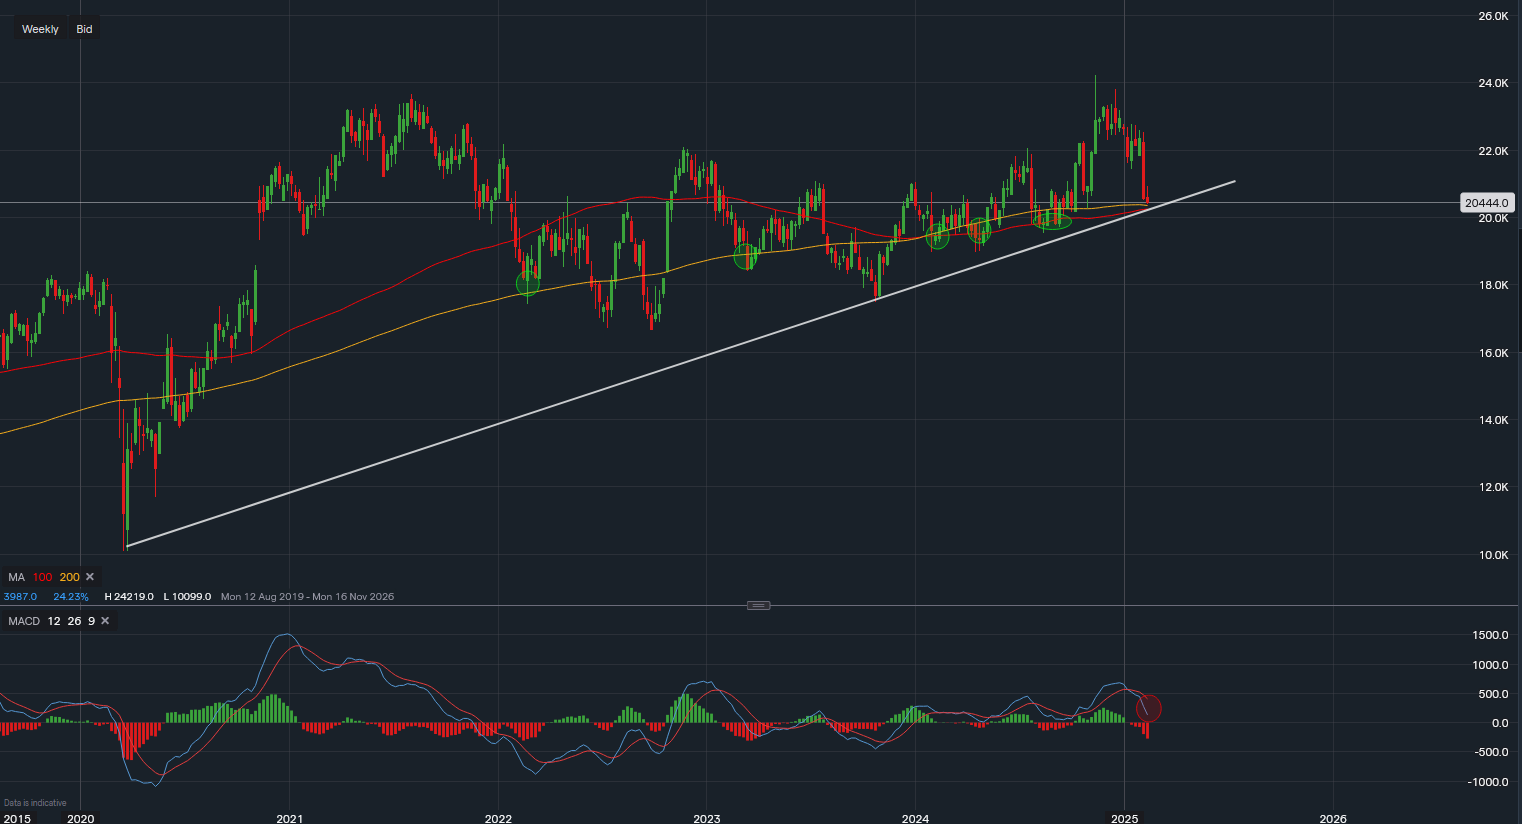
Chart & Data from IG
Honeywell's stock price is approaching a crucial technical level on the weekly chart, making it a key focus for investors and traders. Currently, Honeywell (HON) shares are trading at approximately $204.44, marking a decline of just over 8% year-to-date (YTD).
A critical observation on the Honeywell stock chart is that the price is nearing both the 100-day and 200-day moving averages. Historically, this has served as a strong support level, with prices bouncing off these moving averages on at least five occasions since February 2022.
Additionally, an ascending trendline—which dates back to the COVID-19 lows—further reinforces this support zone around the $200 price level. Based on these technical factors, it is likely that buyers will step in around $200 per share, potentially stabilising the price.
While these indicators suggest strong support, they do not guarantee an immediate price increase. Instead, near-term consolidation is a possibility. A break below $200 could trigger panic selling, leading to further declines towards $190 and potentially $180. However, signs of consolidation at this level may reduce volatility and set the stage for an upward trend continuation.
One technical factor weighing on Honeywell’s price action is the MACD (Moving Average Convergence Divergence) indicator, a widely used tool to measure market momentum. Currently, the MACD has crossed below its signal line, indicating a shift towards bearish momentum. This may deter some investors and traders from entering new positions until stability is re-established.
As Honeywell stock hovers near a key technical support level, investors should closely monitor price action in the coming weeks. A bounce from $200 could signal renewed bullish interest, while a break below may lead to further declines.
Stay tuned as we track Honeywell’s price movements, technical indicators, and market sentiment to gauge its next move.

Tradable assets:
Min.Deposit:
Max Leverage:
FCA:

Rating:


 Earnings Calendar
  Economic Calendar
  VAT Calculator
  Tax Free Childcare Calculator
 Percentage Calculator
 Compound Interest Calculator
  Loan Overpayment Calculator
 Mortgage Calculator
 Credit Card Calculator
 Investing
  Economics
 Trading
  Technical Analysis
  Personal Finance
 Calculator


