General Dynamics (GD) Fundamental and Technical Stock Analysis: Can the Defence Prime Keep Outperforming?
$364.70
04 Mar 2026, 12:54
Neutral

Join Minipip Academy and access free courses in investing, trading, economics, and more.
Sign Up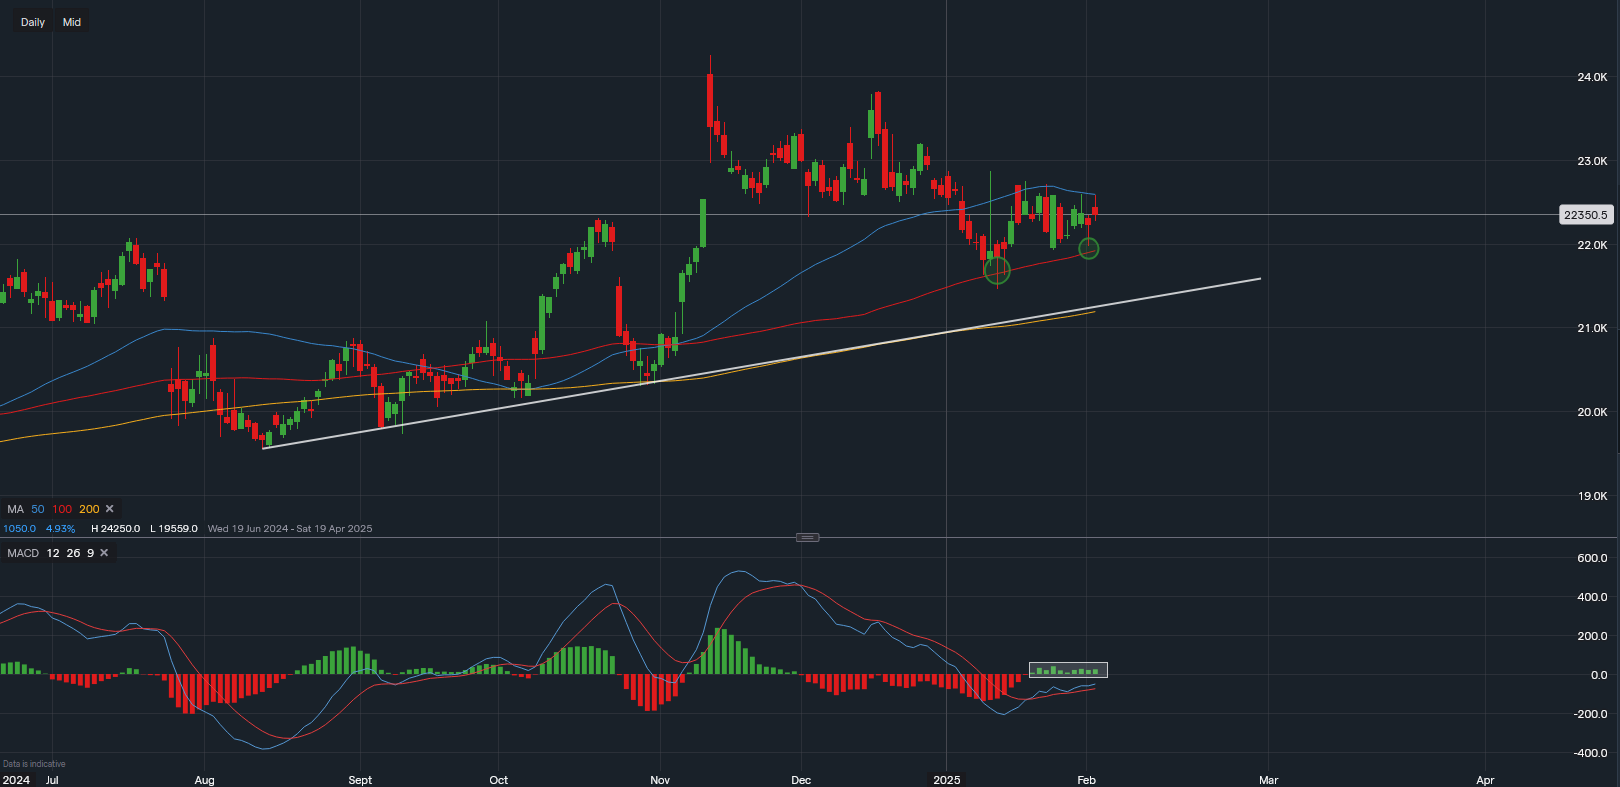
Chart & Date from IG
Honeywell International Inc. (HON) stock has been in a tight consolidation range between $219 and $225 since January 13th, with traders closely watching for a breakout. With earnings set for release tomorrow, investors are eyeing this event as a potential catalyst for price movement in the near term.
During yesterday’s trading session, Honeywell shares closed at $223.50, reflecting a 2% decline year-to-date (YTD). The daily chart clearly highlights a consolidation phase over the past few weeks, which often precedes a significant price move, especially when a major event like an earnings report is on the horizon.
A key technical indicator, the MACD (Moving Average Convergence Divergence) volume, further reinforces this consolidation. The green volume bars have remained relatively steady without major spikes, indicating a tug-of-war between buyers and sellers. However, the MACD is in positive territory, suggesting bullish momentum may have an edge heading into earnings.
Options data currently suggests a potential post-earnings move of around 4.5%, though actual price action may vary. If Honeywell's earnings surprise to the upside, the stock could rally towards $232, but resistance is likely near $227-$228, where some profit-taking might occur.
On the downside, the stock has tested the 100-day moving average (100MA) twice, holding firm as a key support level. A break below $219.71 could trigger further declines toward $214.69, with the next major support at the ascending trendline dating back to August 2023. This trendline aligns with the 200-day moving average (200MA) at $212.50-$213, reinforcing a strong support zone.
With earnings on the horizon, investors are closely monitoring Honeywell’s financial results to gauge its medium-term outlook. If the company delivers strong earnings and guidance, we could see an upside breakout, while disappointing results may trigger a test of lower support levels.
We’ll be tracking the stock’s post-earnings reaction to assess potential buying opportunities or downside risks. Stay tuned for updates as Honeywell's stock price action unfolds.

Tradable assets:
Min.Deposit:
Max Leverage:
FCA:

Rating:


 Earnings Calendar
  Economic Calendar
  VAT Calculator
  Tax Free Childcare Calculator
 Percentage Calculator
 Compound Interest Calculator
  Loan Overpayment Calculator
 Mortgage Calculator
 Credit Card Calculator
 Investing
  Economics
 Trading
  Technical Analysis
  Personal Finance
 Calculator


