AbbVie (ABBV) Stock Analysis: Humira Decline, New Drug Growth, and Technical Consolidation
$228.47
06 Mar 2026, 17:58
Neutral

Join Minipip Academy and access free courses in investing, trading, economics, and more.
Sign Up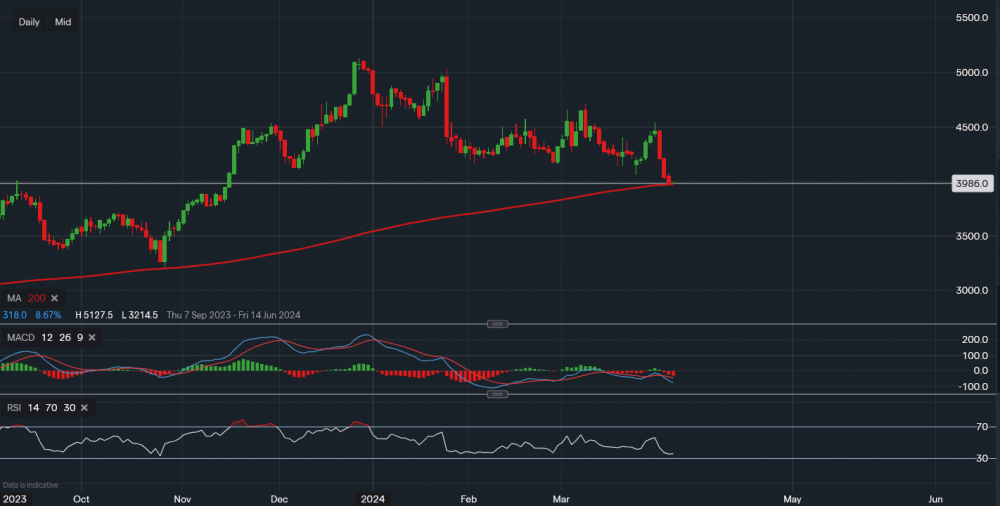
Chart & Data from IG
Taking a look at Intel as its share price is now down almost 21% from its peak in 2024. Currently, its shares are trading at around $39.86 in the pre-market session. Looking at the daily chart, we can see that the share price has now approached a key support level, its own 200-day moving average. The 200MA support reads $39.74, which was tested yesterday but the price is managing to uphold itself above for the time being. A break and close below the moving average would indicate that selling pressure is increasing, leading to a potential fall of another 19%. Or respectively, $32-$33 a share. However, with this being a clear psychological support point, we may see a small bounce here before any further direction is determined. The resistance now reads $40.77, which is yesterday's high. A break and close above this level may lead to an extension towards $41-$42. Although, the bias for the near term has now shifted towards a bearish outlook. The technical indicators certainly suggest that further downside may be likely. The MACD has now turned negative and the RSI is already negative as it reads 36.

Tradable assets:
Min.Deposit:
Max Leverage:
FCA:

Rating:


 Earnings Calendar
  Economic Calendar
  VAT Calculator
  Tax Free Childcare Calculator
 Percentage Calculator
 Compound Interest Calculator
  Loan Overpayment Calculator
 Mortgage Calculator
 Credit Card Calculator
 Investing
  Economics
 Trading
  Technical Analysis
  Personal Finance
 Calculator


