General Dynamics (GD) Fundamental and Technical Stock Analysis: Can the Defence Prime Keep Outperforming?
$364.70
04 Mar 2026, 12:54
Neutral

Join Minipip Academy and access free courses in investing, trading, economics, and more.
Sign Up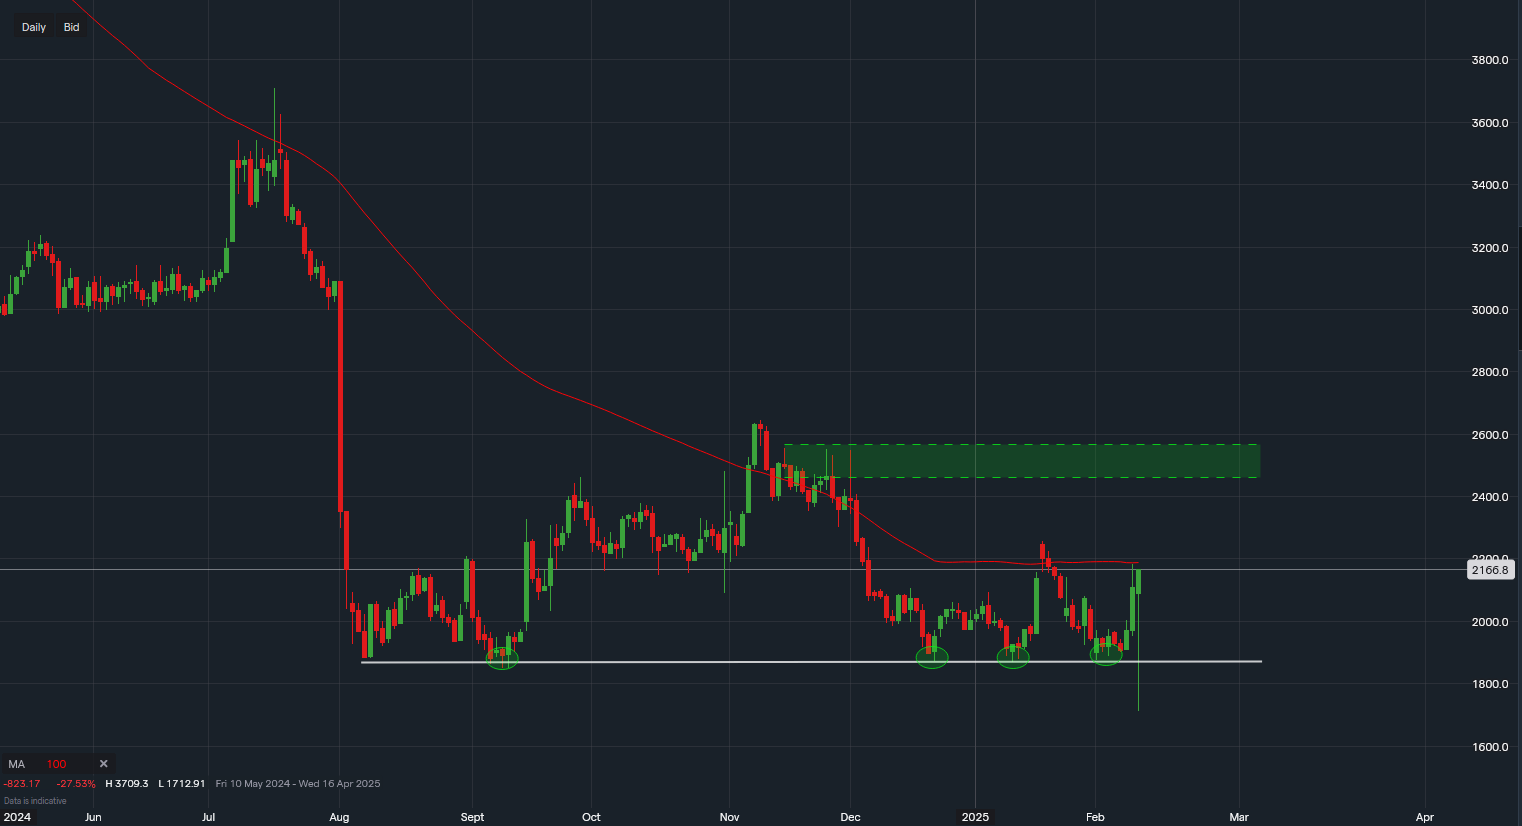
Chart & Data from IG
Intel (NASDAQ: INTC) is showing strength in pre-market trading, up 4% on the day, with shares currently priced around $21.66. The stock appears to be gaining momentum, and key technical indicators suggest a potential breakout.
Looking at Intel’s daily chart, we can see a strong support base has formed around $18.70—a level that has been tested four times since August. This repeated test has likely attracted buyers, leading to the recent uptick in price.
Currently, Intel is testing resistance at the 100-day moving average (~$22). This level previously acted as resistance in January, when the price was rejected. If Intel breaks and closes above $22, we could see a rally toward the next key resistance zone at $24-$25—representing an additional 12% upside from current levels.
On the downside, the $18.70 support base remains the most critical level to monitor. A clear break and close below this level could signal further downside pressure, leading to additional losses for the stock.
For traders and investors, keeping an eye on volume, market sentiment, and broader tech sector trends will be crucial in determining Intel’s next move.

Tradable assets:
Min.Deposit:
Max Leverage:
FCA:

Rating:


 Earnings Calendar
  Economic Calendar
  VAT Calculator
  Tax Free Childcare Calculator
 Percentage Calculator
 Compound Interest Calculator
  Loan Overpayment Calculator
 Mortgage Calculator
 Credit Card Calculator
 Investing
  Economics
 Trading
  Technical Analysis
  Personal Finance
 Calculator


