Intuit Inc. Stock Analysis: Is INTU Undervalued Ahead of Earnings?
$393.09
26 Feb 2026, 20:42
Bullish

Join Minipip Academy and access free courses in investing, trading, economics, and more.
Sign Up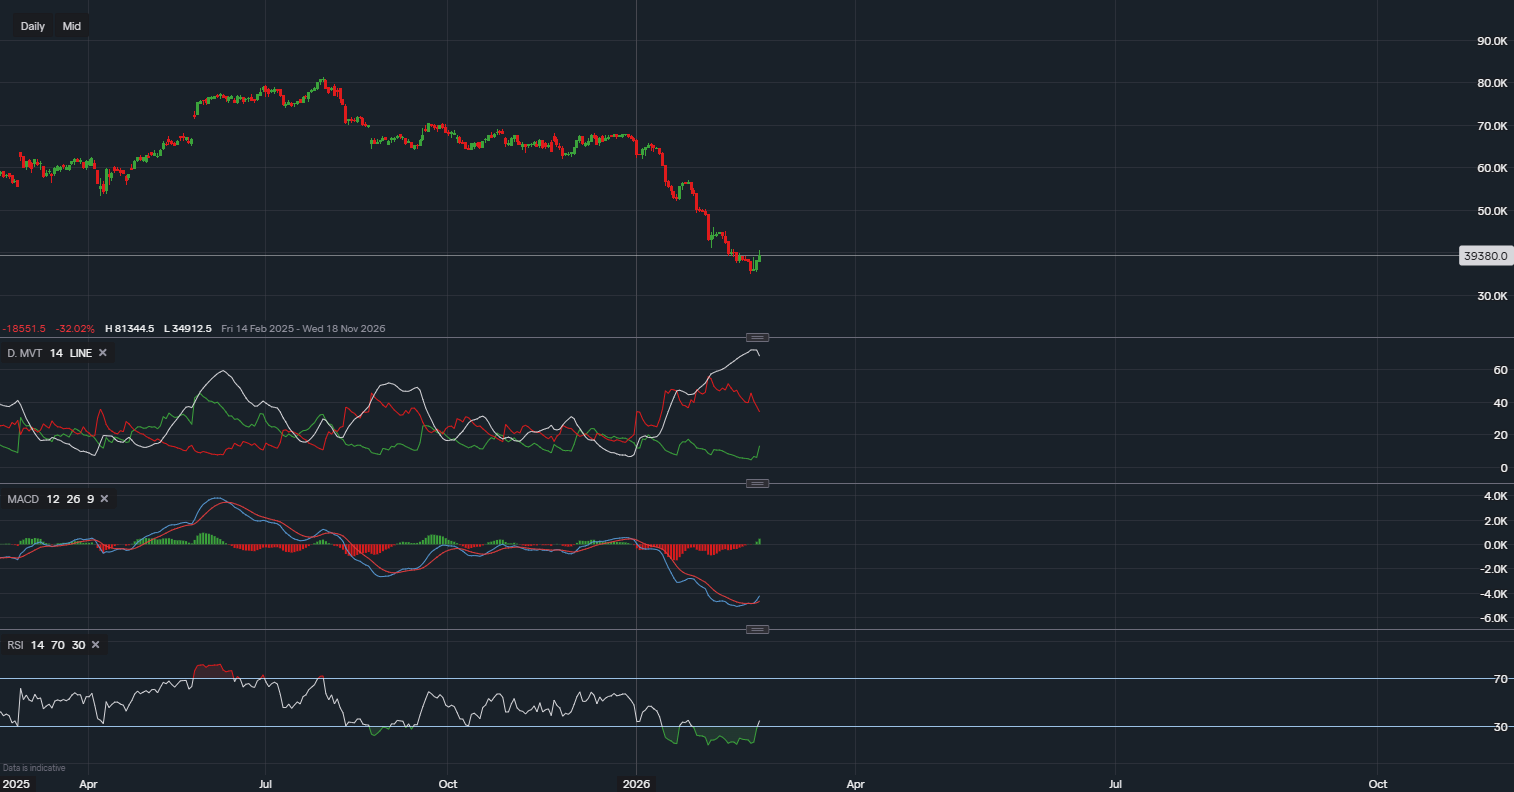
Intuit Inc. Stock Analysis: Is INTU Undervalued Ahead of Earnings?
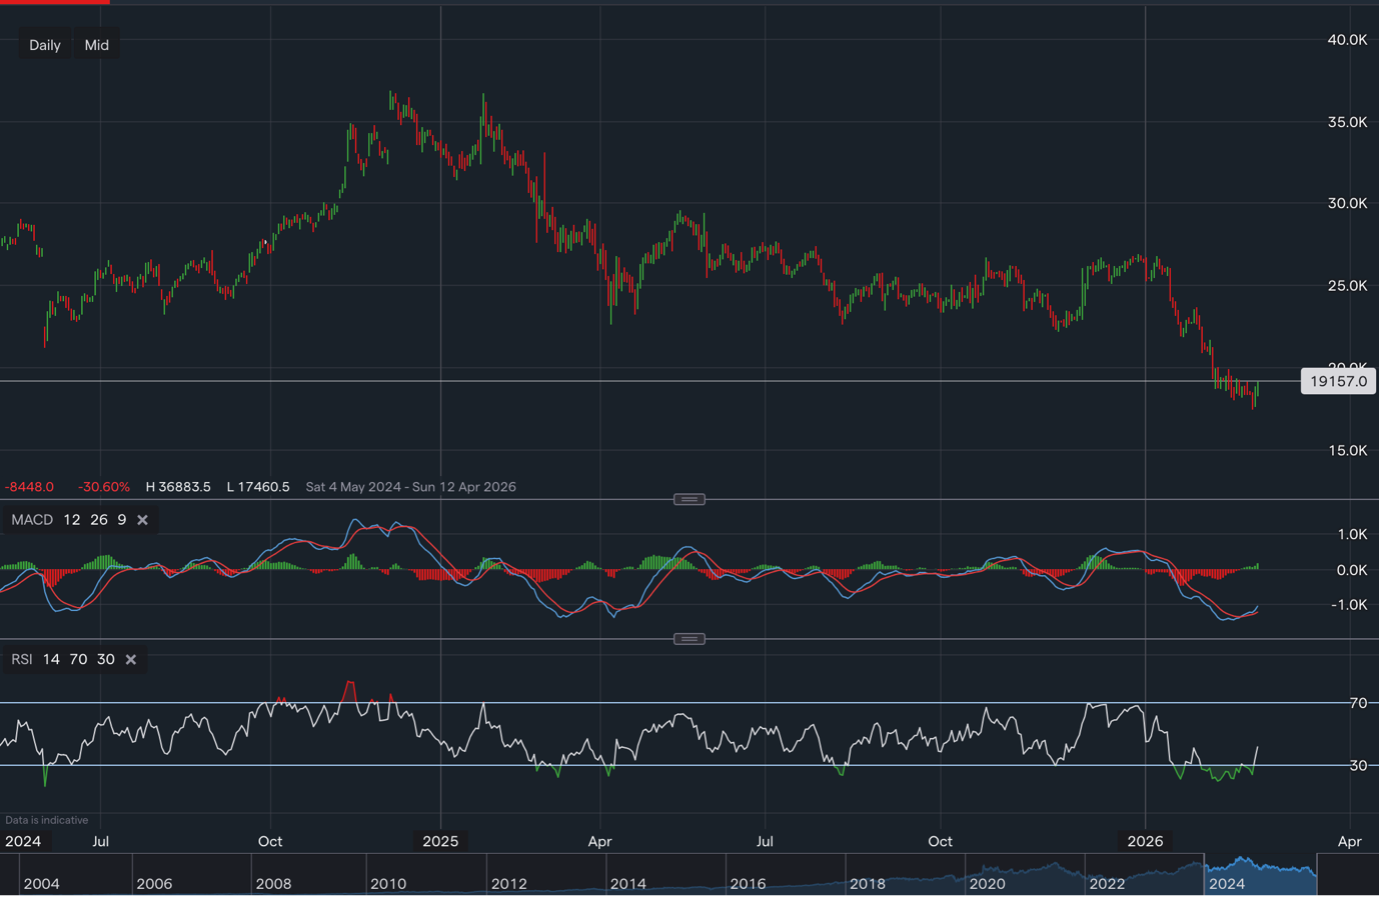
Following a strong bearish rally beginning on 29 December, Intuit Inc. (NASDAQ: INTU) has experienced a notable upside pullback. This recent price recovery is likely driven by investor anticipation ahead of the company’s earnings report scheduled for 26 February 2026.
With volatility increasing ahead of earnings, traders are now questioning whether this marks the beginning of a larger-scale bullish reversal for Intuit shares.
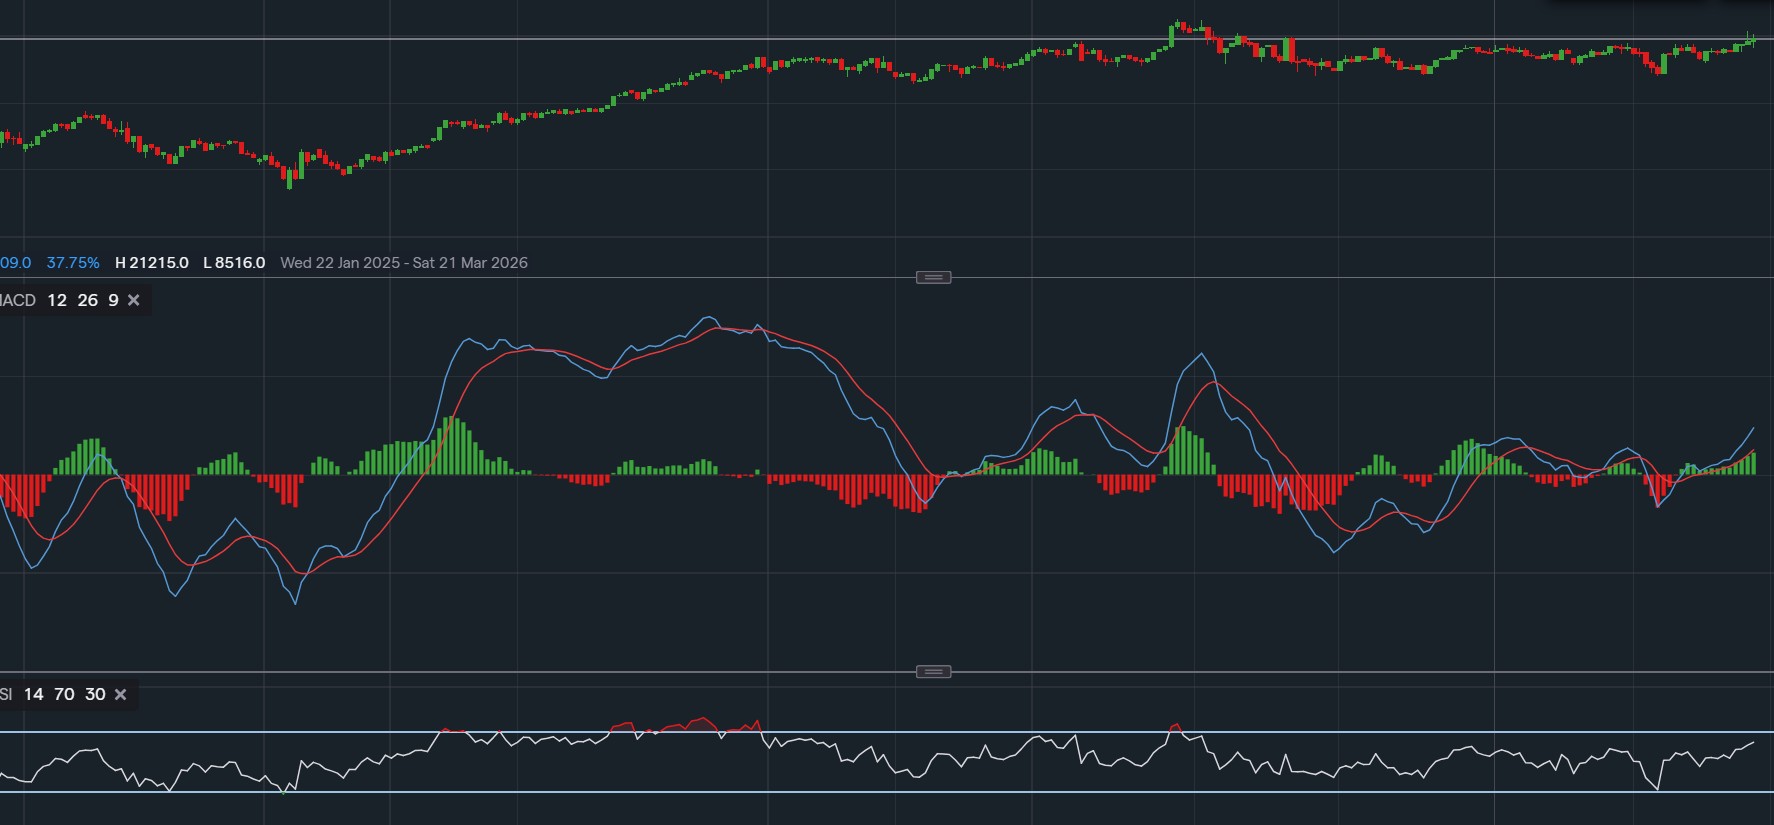
The Relative Strength Index (RSI) recently printed a minimum reading of 15, signalling extremely oversold conditions.
RSI below 30 typically indicates oversold territory
A reading of 15 suggests strong selling exhaustion
Historically, such levels often precede technical rebounds
This supports the case for a potential short-term bullish reversal.
The MACD histogram has begun printing bullish bars, indicating strengthening upward momentum. When combined with oversold RSI conditions, this adds further confirmation of a possible reversal setup.
The DI+ and DI- lines are beginning to converge. A bullish crossover could confirm a shift from bearish dominance to renewed buying pressure.
$411.54
$520.85
$619.64
These price zones serve as upside targets if bullish momentum continues.
$353.47
This remains a critical downside level. A break below this support would invalidate the short-term bullish thesis.
According to 8 analyst estimates, Intuit is expected to report:
Earnings Per Share (EPS): $2.23
Previous year EPS: $2.07
Expected YoY growth: +7.73%
Despite this anticipated growth, the stock price has fallen 62.34%, declining from $636.26 (26 February 2025) to $391.92 (26 February 2026).
This disconnect between earnings growth and price performance may suggest that INTU stock is currently undervalued, particularly if the upcoming earnings report exceeds expectations.
Intuit’s valuation metrics remain attractive:
P/E Ratio: 26.83 (fair value range)
Forward P/E Ratio: 14.87 (suggesting undervaluation based on projected earnings)
High Target: $709.25 (+80.43%)
Low Target: $551.19 (+40.22%)
These projections align closely with the average analyst price target of $705.33, reinforcing the undervaluation thesis.
Despite a substantial price decline over the past year, Intuit continues to demonstrate:
Positive earnings growth expectations
Attractive forward valuation
Technical reversal signals
Strong long-term fundamentals
If earnings outperform expectations, upside potential appears significant. Conversely, downside risk may be limited given the already substantial correction in share price.
With bullish technical indicators aligning with strong fundamental valuation metrics, Intuit may be approaching a pivotal turning point.
Short-term traders may look to capitalise on earnings-driven volatility and technical momentum.
Long-term investors may see current price levels as an attractive accumulation opportunity, provided earnings confirm growth stability.
As always, risk management remains essential, particularly around earnings events where volatility can be elevated.
Intuit appears technically oversold, fundamentally undervalued, and positioned ahead of a potentially strong earnings catalyst. Should the company deliver solid results on 26 February 2026, a broader bullish reversal could unfold in the weeks and months ahead.

Tradable assets:
Min.Deposit:
Max Leverage:
FCA:

Rating:


 Earnings Calendar
  Economic Calendar
  VAT Calculator
  Tax Free Childcare Calculator
 Percentage Calculator
 Compound Interest Calculator
  Loan Overpayment Calculator
 Mortgage Calculator
 Credit Card Calculator
 Investing
  Economics
 Trading
  Technical Analysis
  Personal Finance
 Calculator