General Dynamics (GD) Fundamental and Technical Stock Analysis: Can the Defence Prime Keep Outperforming?
$364.70
04 Mar 2026, 12:54
Neutral

Join Minipip Academy and access free courses in investing, trading, economics, and more.
Sign Up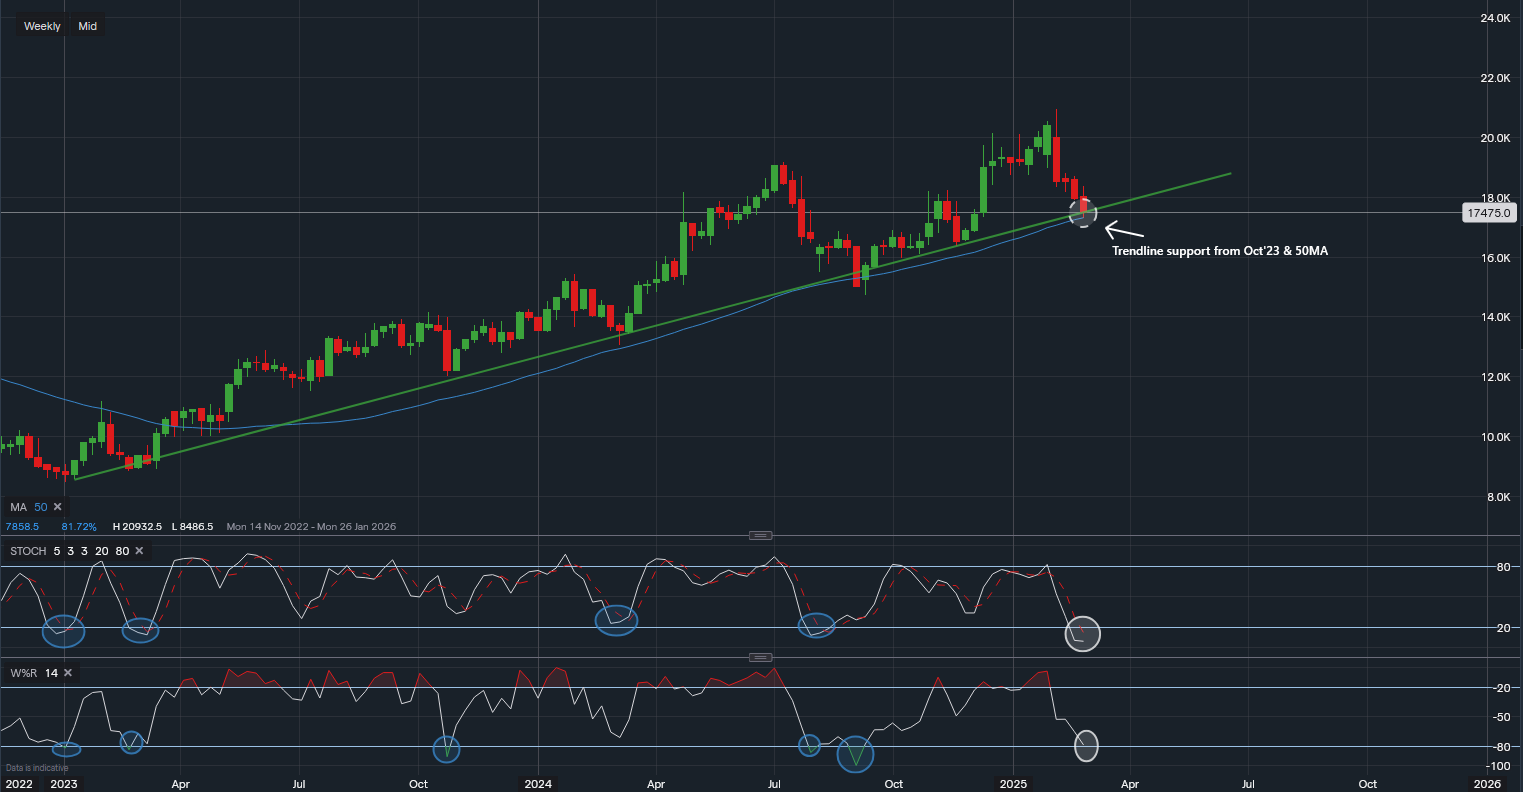
Chart & Data from IG
Alphabet Inc. (GOOGL) is looking oversold based on both weekly and daily charts, suggesting a potential buying opportunity. As of now, Alphabet’s share price is trading around $174.75. A closer look at the technical indicators and trendline support levels suggests that buyers may soon step in.
Examining the weekly chart, we see that GOOGL is testing a long-standing trendline support, dating back to October 2023. Interestingly, this trendline also aligns with the 50-day moving average (50MA), which has been tested at market open.
Historically, each time Alphabet’s share price has retraced to this level, it has bounced back, suggesting strong technical support. This could indicate that we are nearing another potential reversal point.
When applying technical indicators such as the Stochastic Oscillator and Williams %R, we see that Alphabet stock appears oversold.
Zooming into the daily chart, we see additional support around the 200-day moving average (200MA).

While timing the market is challenging, history suggests that GOOGL may be approaching a short-term bottom. Key levels to watch:
- Trendline support at $170-$171 (on the daily chart).
- 200MA acting as a key support level.
- Stochastic, Williams %R, and RSI indicators suggesting oversold conditions.
If buying interest returns at these levels, Alphabet’s share price may see a near-term bounce. However, traders should remain cautious, as technical signals alone don’t guarantee outcomes.

Tradable assets:
Min.Deposit:
Max Leverage:
FCA:

Rating:


 Earnings Calendar
  Economic Calendar
  VAT Calculator
  Tax Free Childcare Calculator
 Percentage Calculator
 Compound Interest Calculator
  Loan Overpayment Calculator
 Mortgage Calculator
 Credit Card Calculator
 Investing
  Economics
 Trading
  Technical Analysis
  Personal Finance
 Calculator


