General Dynamics (GD) Fundamental and Technical Stock Analysis: Can the Defence Prime Keep Outperforming?
$364.70
04 Mar 2026, 12:54
Neutral

Join Minipip Academy and access free courses in investing, trading, economics, and more.
Sign Up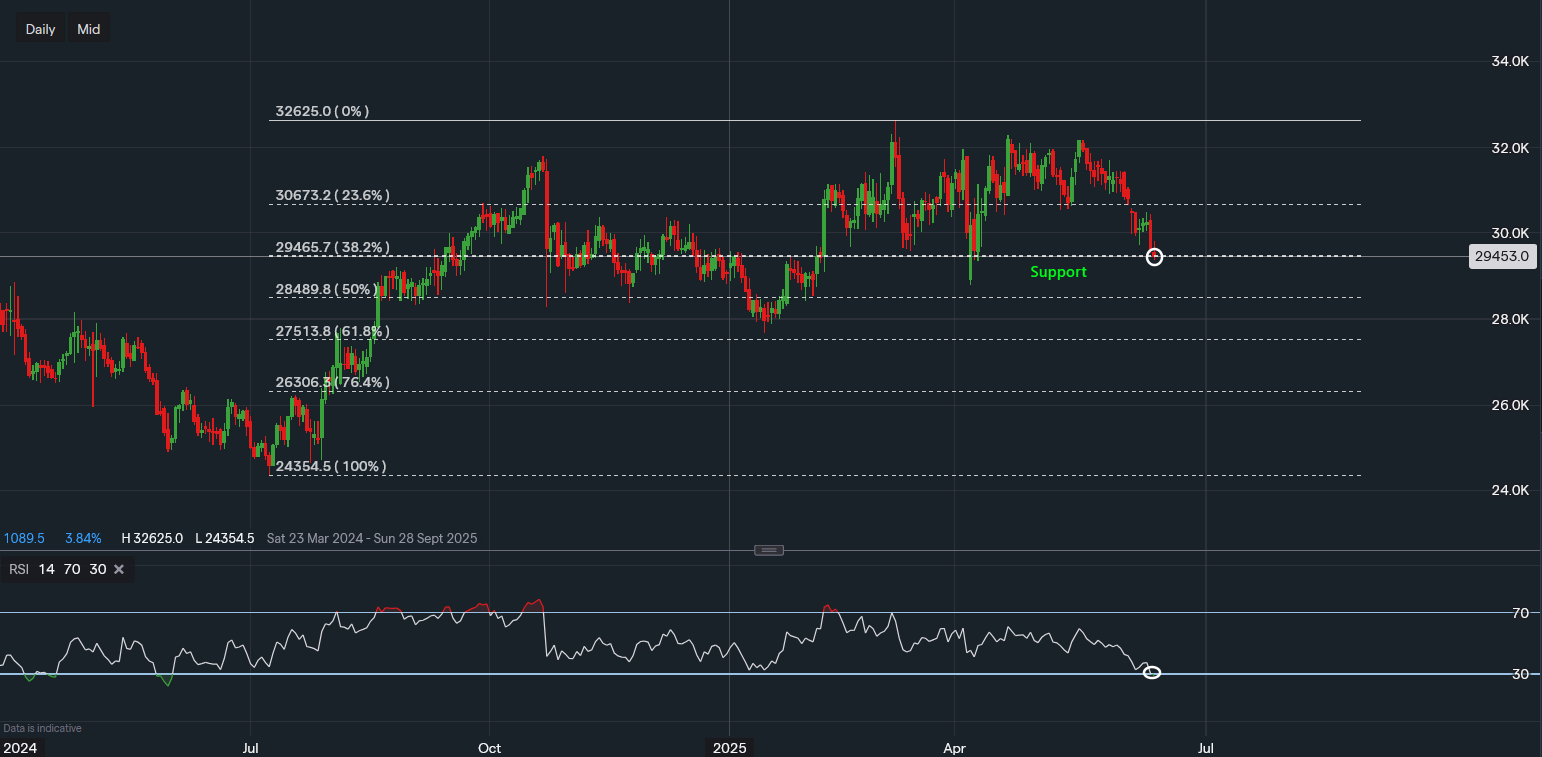
Chart & Data from IG
McDonald’s (NYSE: MCD) share price appears to be entering oversold territory on the daily timeframe, raising the possibility of a near-term bounce — or a deeper correction. As of today, MCD is trading at approximately $294.53, having pulled back significantly from its recent high of $321.00.
Using the Fibonacci retracement tool, we observe that the current price aligns closely with the 38.2% retracement level, sitting at $294.65. This support level may serve as a short-term floor for the stock. However, a decisive break and close below $294.65 could signal renewed bearish momentum.
The next potential downside target lies at the April low of $287.88. Should the selling pressure persist beyond that, the 50% retracement level at $284.89 may act as the next major support zone.
The Relative Strength Index (RSI) has now dipped below 30 for the first time in over a year, currently reading 29. This development signals that McDonald’s may be oversold, which could attract interest from technical traders and swing traders looking for a reversal setup.
However, based on previous price behaviour, McDonald’s has historically continued to decline for an additional 3–4 trading sessions after the RSI enters oversold territory. This suggests that further downside is possible before a more sustainable bounce occurs.
While the stock is approaching a technically significant level, caution remains warranted. Patience could reward traders who wait for stronger confirmation or improved entry conditions, potentially over the coming sessions or early next week.
Disclaimer: This article is for informational purposes only and does not constitute financial advice. Always conduct your own research or consult a qualified advisor before making investment decisions.
Current price: $294.53
38.2% Fibonacci support: $294.65
April low: $287.88
50% Fibonacci support: $284.89
RSI: 29 (oversold)

Tradable assets:
Min.Deposit:
Max Leverage:
FCA:

Rating:


 Earnings Calendar
  Economic Calendar
  VAT Calculator
  Tax Free Childcare Calculator
 Percentage Calculator
 Compound Interest Calculator
  Loan Overpayment Calculator
 Mortgage Calculator
 Credit Card Calculator
 Investing
  Economics
 Trading
  Technical Analysis
  Personal Finance
 Calculator


