General Dynamics (GD) Fundamental and Technical Stock Analysis: Can the Defence Prime Keep Outperforming?
$364.70
04 Mar 2026, 12:54
Neutral

Join Minipip Academy and access free courses in investing, trading, economics, and more.
Sign Up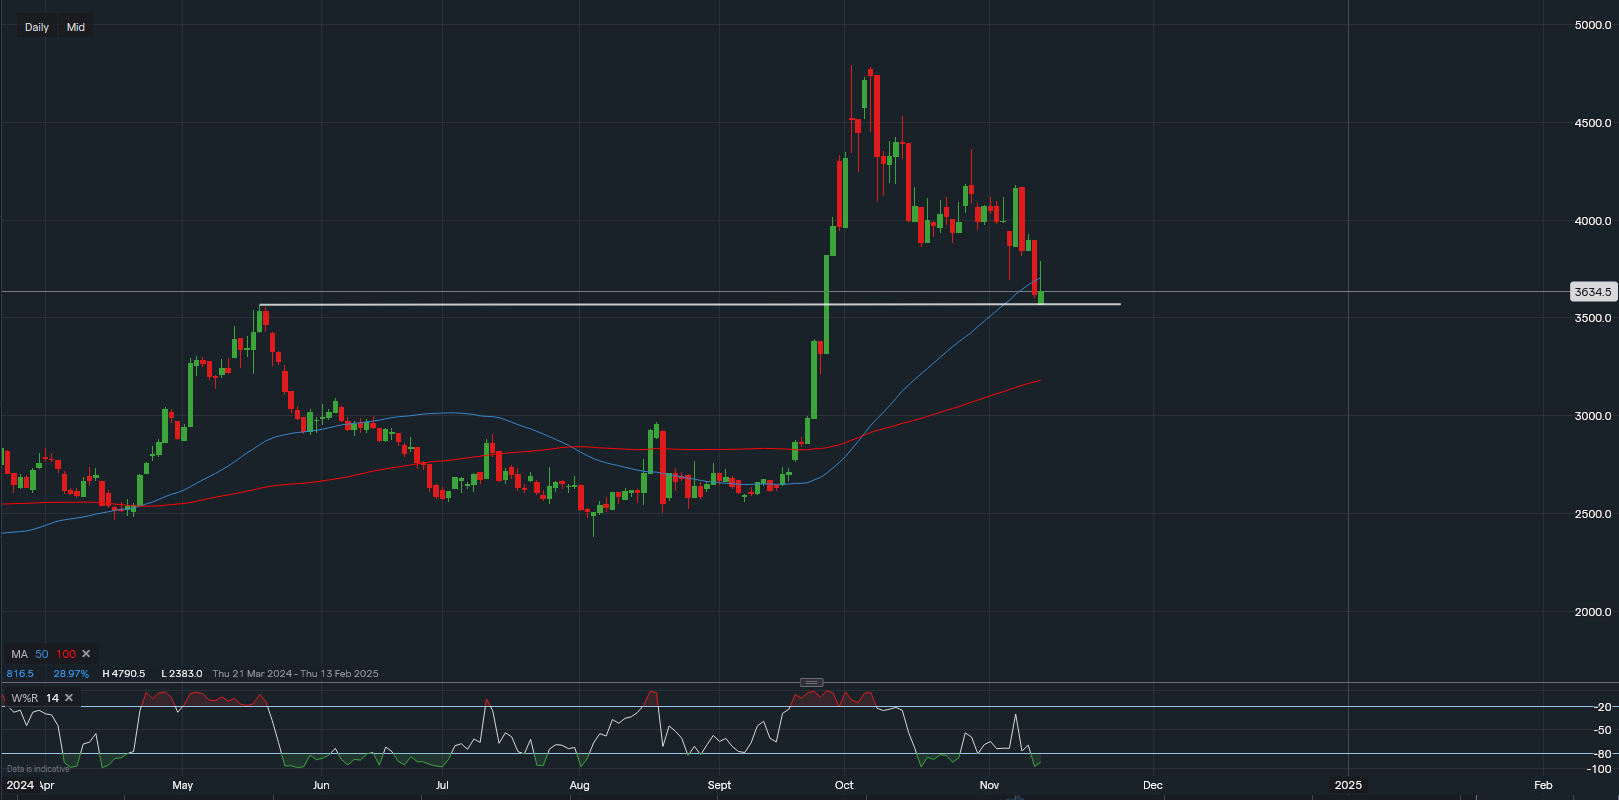
Chart & Data from IG
As JD.com Inc prepares to announce earnings tomorrow, investors are watching closely amid volatility in Chinese stocks. Recently, Chinese equities have faced downward pressure, largely due to profit-taking after a strong rally from September into October. This rally was initially fueled by news of economic stimulus from the Chinese government aimed at revitalizing its economy. However, market sentiment has since soured, especially after Donald Trump's election victory, raising concerns about potential tariff increases that could impact key Chinese stocks, including JD.com.
Currently, JD.com shares are trading at approximately $36.34 in pre-market, with the daily chart showing a crucial retracement to a key support level. For JD.com’s stock to maintain an upward trajectory, it is essential that it rebounds from this level to reinforce investor confidence. The $35.67 price point, a former resistance level, now appears to act as support. A bounce from here would suggest this is a technical re-test of the resistance-turned-support area, possibly indicating that tariff concerns may be easing in the near term.
On the upside, JD.com faces resistance at $41.77, followed by $43.61, and this year’s high of $47.84. A breakout above $47.84 could open the path for a move toward the $50-$55 range, potentially marking a continuation of its bullish run. However, should JD.com fail to stay above the $34-$36 support zone, a sell-off could ensue, with the price potentially declining toward the 100-day moving average (currently at $31.81). This level may serve as a critical support point, where traders could find buying opportunities.
The Williams %R indicator currently shows JD.com’s stock as somewhat oversold, suggesting that a surge in buying could occur leading into the earnings announcement. Additionally, the weekly chart indicates that JD.com is approaching its 100-day moving average, which sits at $34.04. If post-earnings volatility tests this level, a drop below $34 could increase the likelihood of a sell-off.

(Chart & Data from IG)
Key Takeaways:
With these levels and indicators in mind, JD.com’s earnings report will be pivotal, potentially influencing the stock's direction in the short and medium term. Investors will be watching closely to see if the stock can hold support or if it will test lower levels, setting up new trading opportunities.

Tradable assets:
Min.Deposit:
Max Leverage:
FCA:

Rating:


 Earnings Calendar
  Economic Calendar
  VAT Calculator
  Tax Free Childcare Calculator
 Percentage Calculator
 Compound Interest Calculator
  Loan Overpayment Calculator
 Mortgage Calculator
 Credit Card Calculator
 Investing
  Economics
 Trading
  Technical Analysis
  Personal Finance
 Calculator


