General Dynamics (GD) Fundamental and Technical Stock Analysis: Can the Defence Prime Keep Outperforming?
$364.70
04 Mar 2026, 12:54
Neutral

Join Minipip Academy and access free courses in investing, trading, economics, and more.
Sign Up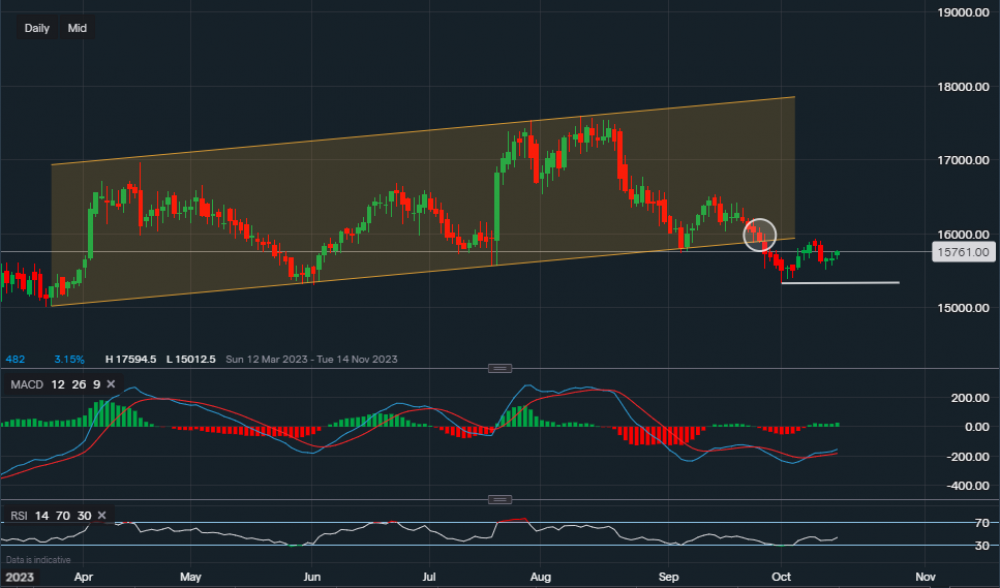
Chart & Data from IG
Johnson & Johnson is due to report earnings tomorrow alongside some of the major financial players, though we can see that its stock price has broken out of the channel drawn on the chart and not to the upside. Currently, its shares are trading at around $157.61 a share and the breakout is highlighted by the white oval. The new important support level is also outlined by the white trendline, which reads $153.32. A move below this level may see an extension lower towards $150.12, another vital support level. On the other hand, this could be perceived as a bull trap as the support of $153.32 only exists because the support of $153.17 upheld its strength. Hence, a positive earnings report could result in a move higher and back into the channel. At this moment in time, the resistance sits at $159.29. A break above this point would see the price back in the channel where the lower trendline of the channel would act as support once again. But this will be unclear until after the earnings are released and volatility lowers. Regarding the technical indicators, they portray a similar picture as do the majority of stocks ahead of the earnings call. Mixed signals. MACD is slightly positive with a negative RSI as it reads 43, although the RSI seems like it's drifting higher.

Tradable assets:
Min.Deposit:
Max Leverage:
FCA:

Rating:


 Earnings Calendar
  Economic Calendar
  VAT Calculator
  Tax Free Childcare Calculator
 Percentage Calculator
 Compound Interest Calculator
  Loan Overpayment Calculator
 Mortgage Calculator
 Credit Card Calculator
 Investing
  Economics
 Trading
  Technical Analysis
  Personal Finance
 Calculator


