General Dynamics (GD) Fundamental and Technical Stock Analysis: Can the Defence Prime Keep Outperforming?
$364.70
04 Mar 2026, 12:54
Neutral

Join Minipip Academy and access free courses in investing, trading, economics, and more.
Sign Up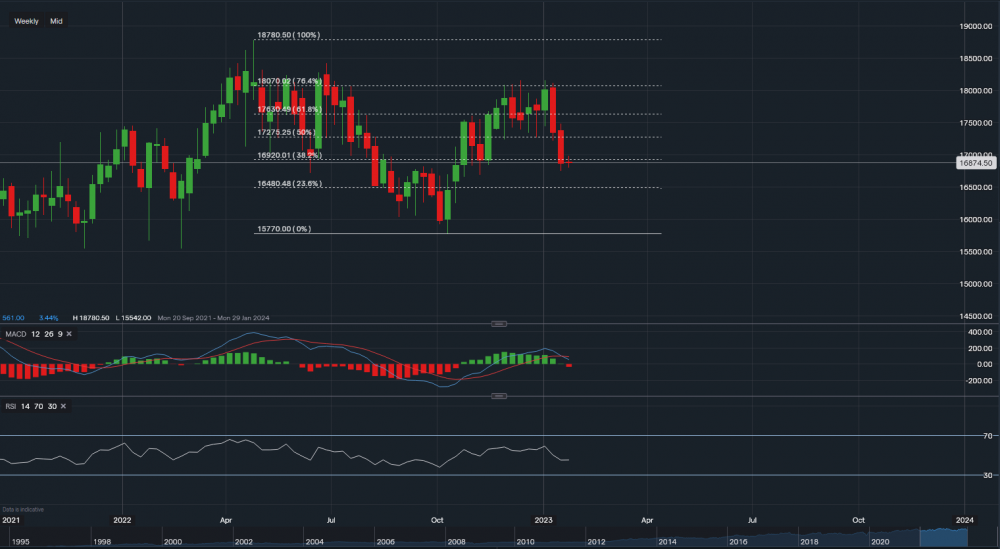
J&J - Chart & Data from IG
Overview
The American global firm Johnson & Johnson (J&J), established in 1886, creates consumer packaged products, medicines, and medical equipment. The firm was rated No. 36 in the 2021 Fortune 500 list of the biggest American corporations by total revenue, and its common stock is a component of the Dow Jones. One of the most valuable firms in the world, Johnson & Johnson is one of just two U.S.-based businesses with a prime credit rating of AAA, which is higher than the rating of the US government.
Financials
Looking at J&J’s fiscal year of 2021 versus 2020, total revenue rose by $11bn and gross profit rose by $9bn year-on-year. EBITDA and net income after tax and operating expenses, both increased by $6bn, resulting in an EPS (earnings per share) of $7.93. This was an increase of 29% in earnings YoY. Looking at its balance sheet, the company has a really strong current asset of $31.6bn in cash on hand. The value of its total assets has risen to $182bn from $174bn, whereas the value of its total liabilities has fallen to $108bn from $111bn. As a result, total equity was raised to $74bn for the year 2021.
Technicals
J&J’s share price is currently sitting around $168.74 a share. Applying the Fibonacci retracement to the chart, support sits at $164.80 (23.6% Fib) and then a major level at $157.70 (0% Fib). A break below the major support could see the stock’s share price fall much further towards the $145-$150 price range. However, towards the upside, minor resistance sits at $169.20 (38.2% Fib) which would also be a good consolidation point for the stock as J&J is set to report quarterly earnings tomorrow. A positive report may turn the current resistance into support. Nevertheless, further support levels sit at $172.75 (50% Fib) and then at $176.30 (61.8% Fib). A jump above these levels could see the price hike towards the tough resistance resting at $180.70 (76.4% Fib). Looking at the technical indicators, MACD has turned negative on the weekly timeframe but RSI is marginally neutral as it reads 45.
Summary
To summarise, on a weekly timeframe, J&J’s stock is rangebound between $155-$187 a share and has been since the back end of 2021. At present, the technical indicators suggest a bearish medium-term bias but the company is due to report quarterly earnings tomorrow. This may have an influence on the price, but it is not guaranteed. Until a clear break above $187 or below $155 occurs, the price should fluctuate between the prices mentioned above. However, the financials of the company are really strong with impressive progress year-on-year. This healthcare giant should only continue this way as healthcare products are a necessity for a majority of people, hence, in the longer term the value of its stock should only increase.


 Earnings Calendar
  Economic Calendar
  VAT Calculator
  Tax Free Childcare Calculator
 Percentage Calculator
 Compound Interest Calculator
  Loan Overpayment Calculator
 Mortgage Calculator
 Credit Card Calculator
 Investing
  Economics
 Trading
  Technical Analysis
  Personal Finance
 Calculator


