General Dynamics (GD) Fundamental and Technical Stock Analysis: Can the Defence Prime Keep Outperforming?
$364.70
04 Mar 2026, 12:54
Neutral

Join Minipip Academy and access free courses in investing, trading, economics, and more.
Sign Up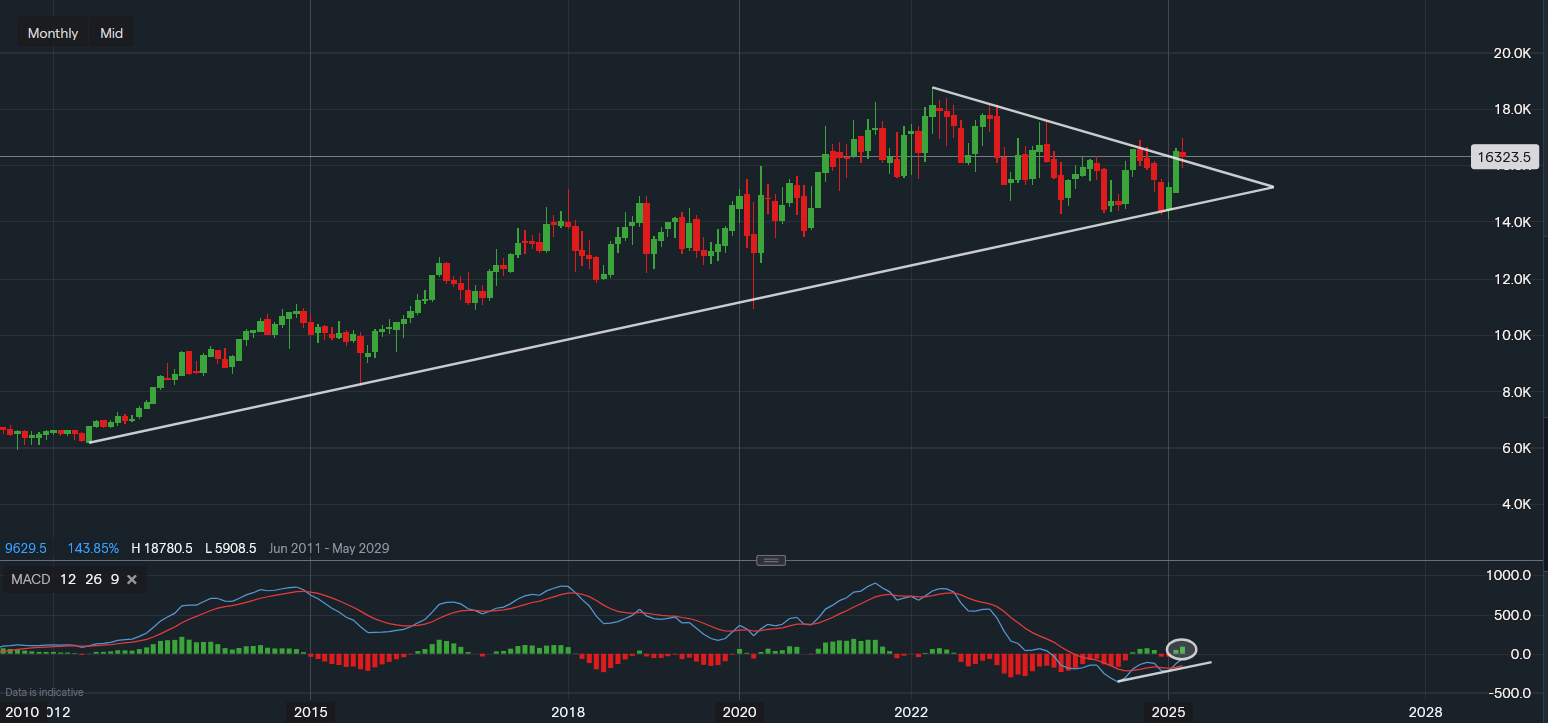
Chart & Data from IG
Johnson & Johnson (NYSE: JNJ) has recently made headlines with its announcement of a $55 billion investment over the next four years, aimed at building new U.S. facilities and expanding its research capabilities. This strategic move not only strengthens the company’s long-term growth potential but may also be supporting a technical breakout on the JNJ stock chart.
On the monthly chart, Johnson & Johnson stock is showing signs of a breakout following a prolonged downtrend. Currently trading around $163.23 per share, JNJ appears to be pushing above the upper trendline of a wedge pattern, a key technical signal that could indicate a bullish reversal.
Notably, the monthly MACD indicator has turned positive for the first time since the failed breakout attempt in September 2023. Additionally, a bullish divergence is forming on the MACD, which often precedes upward momentum in stock prices.
The stock is currently facing resistance at $169.98, a level where some investors have taken profits following the February rally. Broader market uncertainty and economic concerns in the U.S. are also contributing to temporary hesitation among traders. However, with JNJ positioned as a defensive stock, it could benefit from increased interest in lower-risk investments during volatile market conditions.
A clear breakout above $169.98 would likely shift investor focus toward the next key price target at $175.96, followed by the all-time high of $187.80.
On the downside, the former wedge resistance has now become near-term support. Only a decisive move back below $160 would invalidate the current breakout scenario and potentially send JNJ back into consolidation within the wedge pattern.

Tradable assets:
Min.Deposit:
Max Leverage:
FCA:

Rating:


 Earnings Calendar
  Economic Calendar
  VAT Calculator
  Tax Free Childcare Calculator
 Percentage Calculator
 Compound Interest Calculator
  Loan Overpayment Calculator
 Mortgage Calculator
 Credit Card Calculator
 Investing
  Economics
 Trading
  Technical Analysis
  Personal Finance
 Calculator


