AbbVie (ABBV) Stock Analysis: Humira Decline, New Drug Growth, and Technical Consolidation
$228.47
06 Mar 2026, 17:58
Neutral

Join Minipip Academy and access free courses in investing, trading, economics, and more.
Sign Up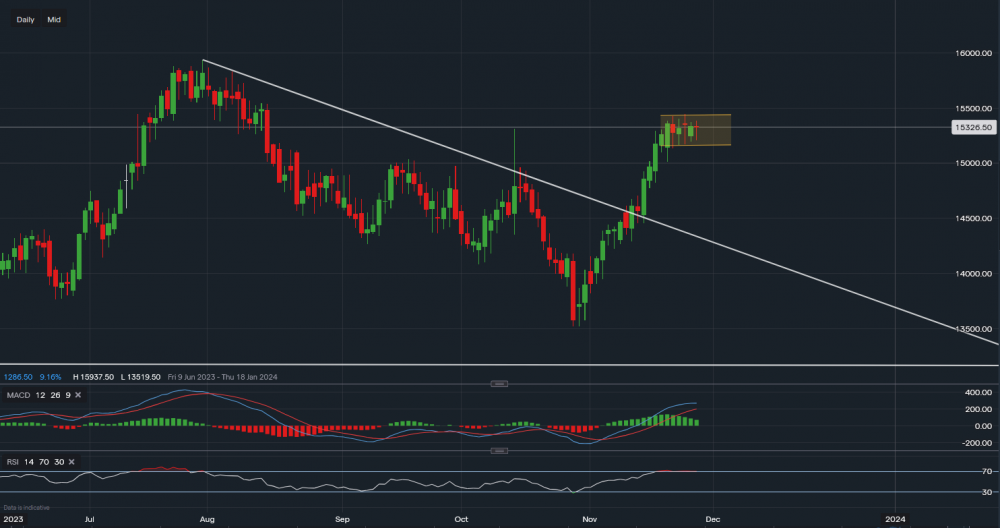
Chart & Data from IG
Taking a look at JPMorgan as we can see that a clear break out of the descending triangle has occurred, shifting the bias from bearish to neutral-bullish. Currently, the bank’s shares are trading at around $153.26 a share. The underlying resistance now sits at $154.44, and we can see this is the case as the price has been moving sideways since this time last week. A break and close above this level may see its share price rise higher with the primary target then of $159.37 (this year’s high). The minor support base sits at $151.33, a break below it could then test the support of $150.12. Only a move below $150.12 could see a further retracement. If we look at the technical indicators, we can see the MACD is still positive but volume has lowered slightly. Additionally, the RSI reads 70 suggesting that the stock is somewhat overbought. Hence, in the near term, a small pullback due to profit-taking is possible.

Tradable assets:
Min.Deposit:
Max Leverage:
FCA:

Rating:


 Earnings Calendar
  Economic Calendar
  VAT Calculator
  Tax Free Childcare Calculator
 Percentage Calculator
 Compound Interest Calculator
  Loan Overpayment Calculator
 Mortgage Calculator
 Credit Card Calculator
 Investing
  Economics
 Trading
  Technical Analysis
  Personal Finance
 Calculator


