General Dynamics (GD) Fundamental and Technical Stock Analysis: Can the Defence Prime Keep Outperforming?
$364.70
04 Mar 2026, 12:54
Neutral

Join Minipip Academy and access free courses in investing, trading, economics, and more.
Sign Up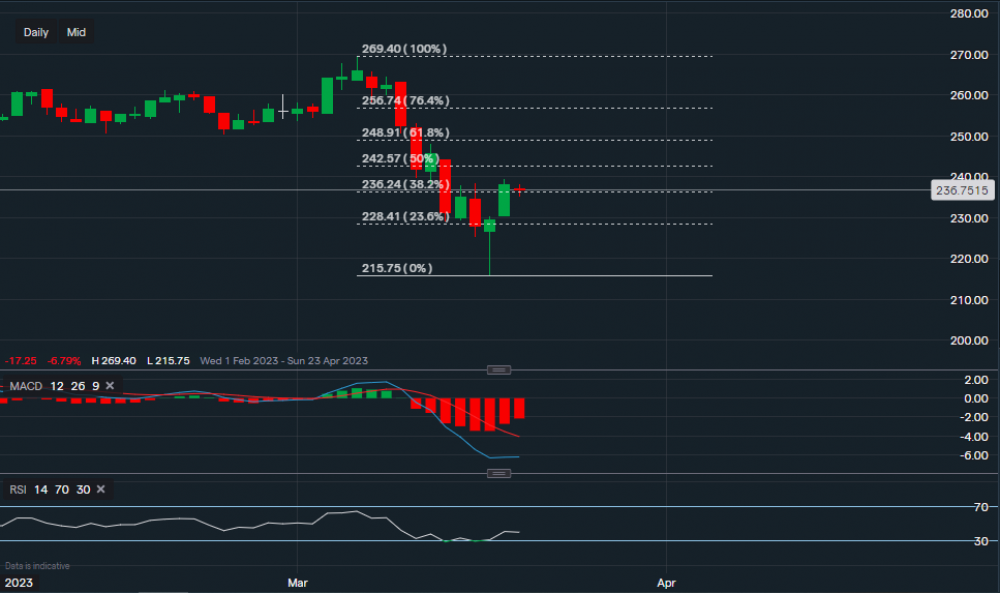
Chart & Data from IG
From a technical viewpoint, L&G’s shares are trading at around 236p a share. Applying the Fibonacci retracement to the chart on the daily timeframe, we can see that a strong support level is present at 215p. This support level formed at the start of this trading week (Monday), which was followed by a bounce higher. A drop below this key support level may see the price of this stock head lower towards roughly 200p a share. On the other hand, as yesterday’s session closed above the 38.2% Fib (236p), the price could continue higher testing the resistance at the 50% and 61.8% Fib retracements. Or respectively, 242p followed by 248p. A break above 248p may even see an effort towards 256-269p, which is the range of the highs of 2023. Over to the technical indicators, they do suggest further negative movement as the MACD line is still some distance away from the signal line and the RSI reads 39. This downfall throughout the middle of March was due to the negative earnings report on the 8th of March, but as we can see the bounce appeared after the RSI suggested the stock was oversold. This may just be a short-term retracement before climbing back to the highs of 2023, hence, creating a potential opportunity for a buy. Especially after the strong rise yesterday.


 Earnings Calendar
  Economic Calendar
  VAT Calculator
  Tax Free Childcare Calculator
 Percentage Calculator
 Compound Interest Calculator
  Loan Overpayment Calculator
 Mortgage Calculator
 Credit Card Calculator
 Investing
  Economics
 Trading
  Technical Analysis
  Personal Finance
 Calculator


