General Dynamics (GD) Fundamental and Technical Stock Analysis: Can the Defence Prime Keep Outperforming?
$364.70
04 Mar 2026, 12:54
Neutral

Join Minipip Academy and access free courses in investing, trading, economics, and more.
Sign Up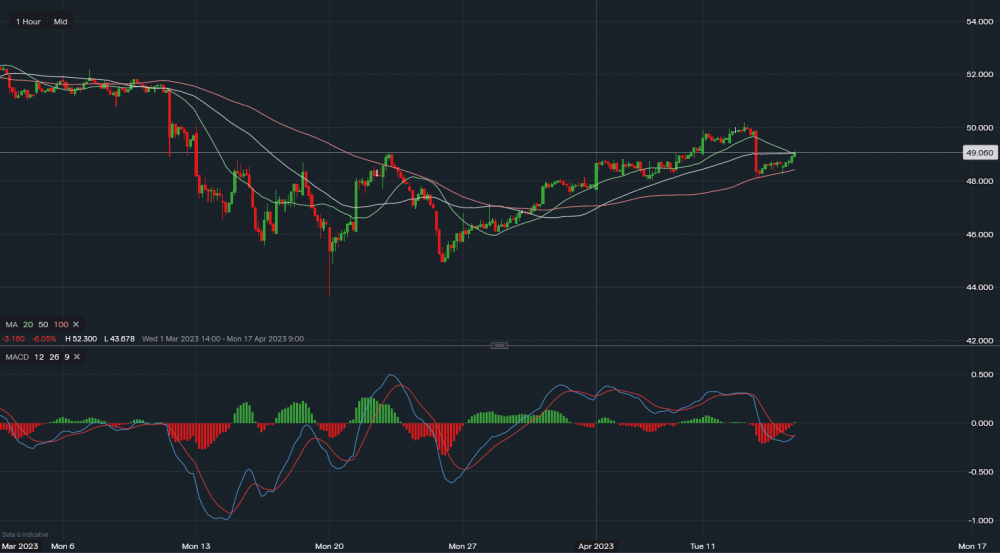
Chart & Data from IG
Lloyds has recovered some of its losses from Thursday's 2.7% drop after JPMorgan announced better-than-expected results, causing the banking sector to recover slightly. Lloyds is lagging behind a little, however because of this it could provide a possible good buying opportunity. Looking at the technical chart, support for Lloyds sits at 48.40p (100 SMA). A breakdown below here could see the stock fall towards 48.00p. MACD has turned positive after the decline yesterday with resistance at the current 49.00p region. A break above here could see Llloyds move towards the weekly highs at 50.00p


 Earnings Calendar
  Economic Calendar
  VAT Calculator
  Tax Free Childcare Calculator
 Percentage Calculator
 Compound Interest Calculator
  Loan Overpayment Calculator
 Mortgage Calculator
 Credit Card Calculator
 Investing
  Economics
 Trading
  Technical Analysis
  Personal Finance
 Calculator


