General Dynamics (GD) Fundamental and Technical Stock Analysis: Can the Defence Prime Keep Outperforming?
$364.70
04 Mar 2026, 12:54
Neutral

Join Minipip Academy and access free courses in investing, trading, economics, and more.
Sign Up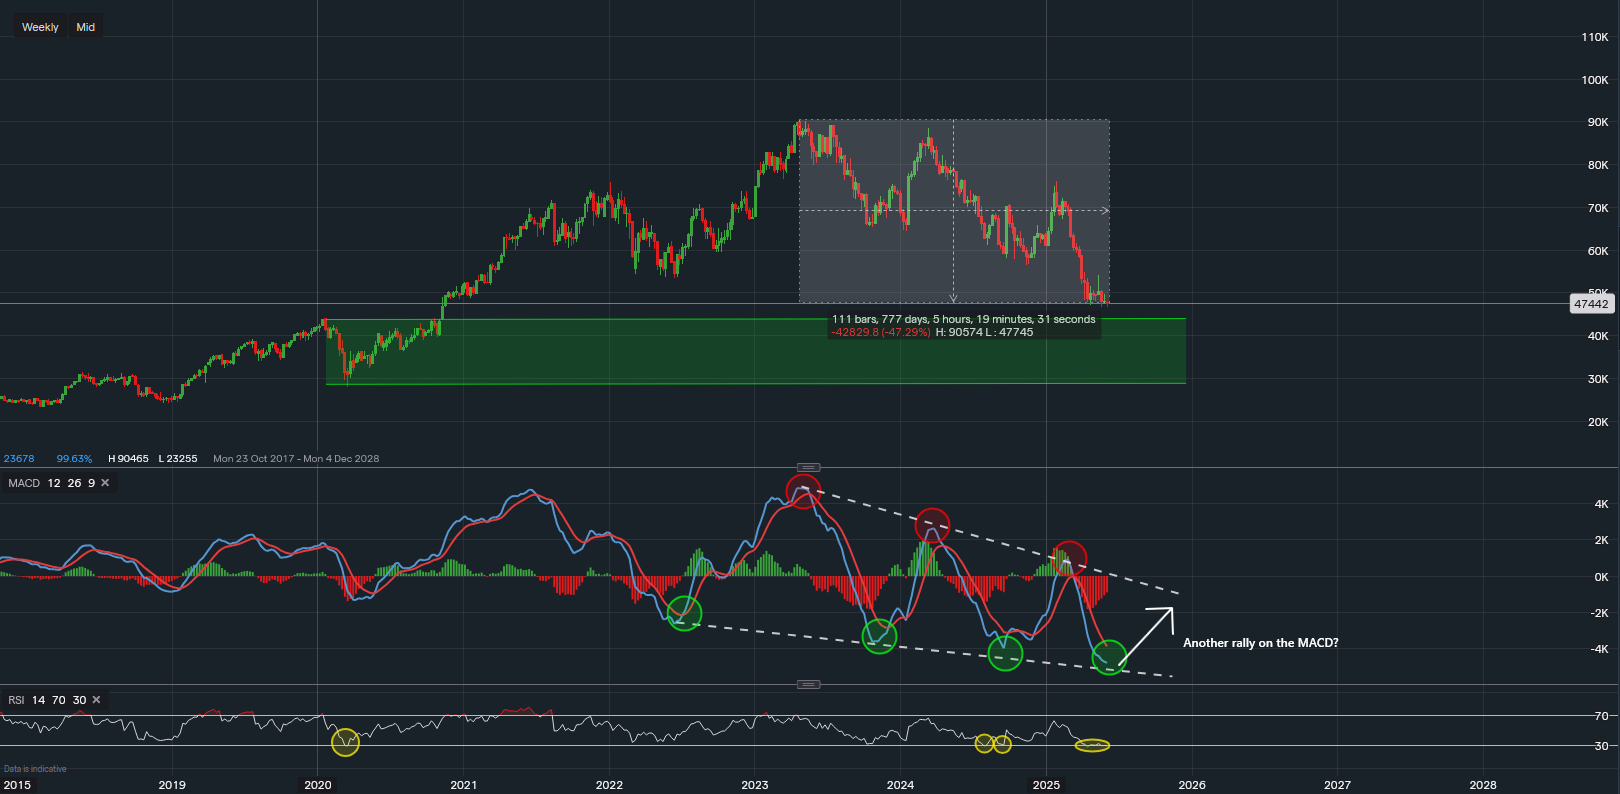
Chart & Data from IG
LVMH (EPA: MC) is currently showing signs of being oversold, particularly on higher timeframes, with the weekly chart highlighting key technical stress. After peaking at €902 in May 2023, LVMH shares have declined by approximately 47%, now trading around €474.42. This sharp decline places the stock at a critical technical juncture.
LVMH is attempting to stabilise above a support zone between €466 and €471, where buying interest has recently emerged. Daily price action shows signs of consolidation, supported by reduced volatility and higher closing prices in recent sessions. This suggests the potential for a short-term base to form.
If the stock breaks below this support range, it could trigger a further decline towards €439.05, a key level that marked resistance in January 2020 and has now flipped to support. A deeper correction could test the next support levels at €390 and €365, respectively.
From a technical standpoint, several indicators suggest that a relief rally may be in the cards:
The Relative Strength Index (RSI) currently reads 29, indicating oversold conditions. This is the second time since April that RSI has dipped this low, and historically, similar levels have led to short-term rebounds.
The MACD (Moving Average Convergence Divergence) is also in oversold territory, with the indicator forming a series of lower highs and lower lows. The current structure hints at a potential MACD base, which could support a price recovery.
Should LVMH stock begin a bounce, initial resistance is seen around €541.15. A successful breakout above this level may open the door for further gains towards the €600 mark, aligning with the upper trendline on the MACD channel.
Conclusion
LVMH stock appears technically oversold, and historical patterns suggest the potential for a short-term rally. However, a break below key support levels could trigger further downside. Investors and traders should watch price action closely around €466–€471 for confirmation of either support holding or breaking down.

Tradable assets:
Min.Deposit:
Max Leverage:
FCA:

Rating:


 Earnings Calendar
  Economic Calendar
  VAT Calculator
  Tax Free Childcare Calculator
 Percentage Calculator
 Compound Interest Calculator
  Loan Overpayment Calculator
 Mortgage Calculator
 Credit Card Calculator
 Investing
  Economics
 Trading
  Technical Analysis
  Personal Finance
 Calculator


