General Dynamics (GD) Fundamental and Technical Stock Analysis: Can the Defence Prime Keep Outperforming?
$364.70
04 Mar 2026, 12:54
Neutral

Join Minipip Academy and access free courses in investing, trading, economics, and more.
Sign Up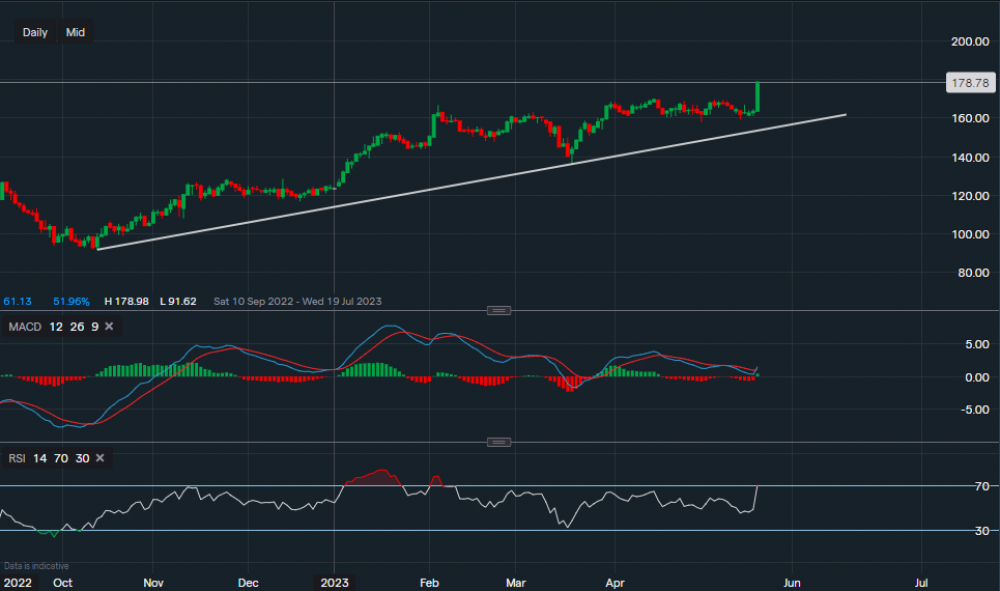
Chart & Data from IG
Earnings Overview
Marks & Spencer, the British apparel and food giant, said its recovery plan was beginning to bear fruit, allowing it to restore its dividend and anticipate "modest" revenue growth this year.
Following decades of unsuccessful turnaround attempts, M&S, under CEO Stuart Machin, is attempting to construct a more robust firm by refocusing on the quality and value of its apparel and food, investing heavily in technology and e-commerce, and undergoing a comprehensive retail estate redesign.
The British retailer announced a better-than-expected 7.8% drop in 2022/23 earnings and stated it had made a solid start to the new fiscal year, with sales increasing across both the clothing and food and home divisions.
According to the group, cost headwinds in 2023/24 will include more than £50 million in increased energy expenses and more than £100 million in additional labour costs. These will be countered by £150 million in cost reductions.
M&S generated a profit before tax and adjustment items of £482 million in the fiscal year to April 1st, above analysts' average projection of £436 million but falling short of the £523 million made in 2021/22.
Profit declined in 2022/23 despite a 9.6% increase in sales to £11.9 billion, owing to rising energy and labour expenses, as well as unfavourable currency movements.
Shares are currently up 9%.
Technicals
From a technical overview, its shares are now trading at around 178p a share. Looking at the daily timeframe, we can see that support is well established below and the bullish trend from October last year is continuing. Support sits along the trendline at 159p, a break below this price could see a move lower to 136p. Only a dip below 136p could indicate that a turnaround is possible. Therefore, as the bias remains bullish after the earnings report, resistance now sits at 194p. A break above 194p may see a rise higher towards 210p-215p. Although, this is more likely in the mid-long term. Over to the technical indicators, MACD has turned positive and so is the RSI as it reads 71. RSI has just entered ‘overbought’ territory.

Tradable assets:
Min.Deposit:
Max Leverage:
FCA:

Rating:


 Earnings Calendar
  Economic Calendar
  VAT Calculator
  Tax Free Childcare Calculator
 Percentage Calculator
 Compound Interest Calculator
  Loan Overpayment Calculator
 Mortgage Calculator
 Credit Card Calculator
 Investing
  Economics
 Trading
  Technical Analysis
  Personal Finance
 Calculator


