General Dynamics (GD) Fundamental and Technical Stock Analysis: Can the Defence Prime Keep Outperforming?
$364.70
04 Mar 2026, 12:54
Neutral

Join Minipip Academy and access free courses in investing, trading, economics, and more.
Sign Up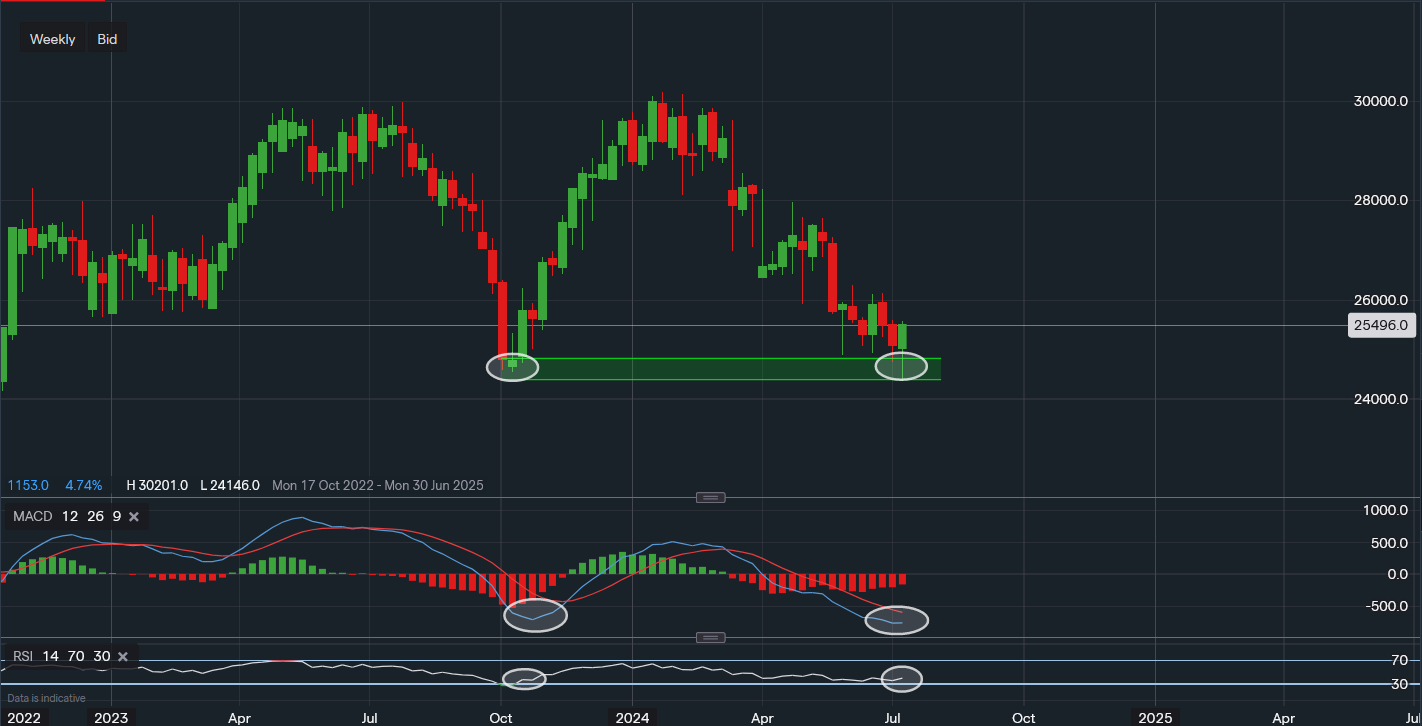
Chart & Data from IG
McDonald’s stock price is at a key support level here on the weekly chart following an almost 20% sell-off from the beginning of the year. The fast food giant’s shares are trading at around $254.96 a share right now in pre-market, we can see that thus far the support has held out. However, a period of some consolidation may be required to uphold this level in the near term. The support area ranges between $247.36 and $243.47, providing a somewhat base for investors. A break below this base to the lows of October 2022, or respectively, $227-$230. As buyers seem to be taking charge this week, the next point of resistance is around $261.25. A move above this level could be an early indication of a shift in momentum once again, especially when we look over to the technical indicators. The positioning of the MACD and the RSI is aligning similarly to the one that occurred in October of last year, however, it is not there yet so caution should remain. Looking closer at the RSI, there may also be a possible bullish divergence forming as the indicator made a higher lower but the price of the stock has made a lower low.

Tradable assets:
Min.Deposit:
Max Leverage:
FCA:

Rating:


 Earnings Calendar
  Economic Calendar
  VAT Calculator
  Tax Free Childcare Calculator
 Percentage Calculator
 Compound Interest Calculator
  Loan Overpayment Calculator
 Mortgage Calculator
 Credit Card Calculator
 Investing
  Economics
 Trading
  Technical Analysis
  Personal Finance
 Calculator


