AbbVie (ABBV) Stock Analysis: Humira Decline, New Drug Growth, and Technical Consolidation
$228.47
06 Mar 2026, 17:58
Neutral

Join Minipip Academy and access free courses in investing, trading, economics, and more.
Sign Up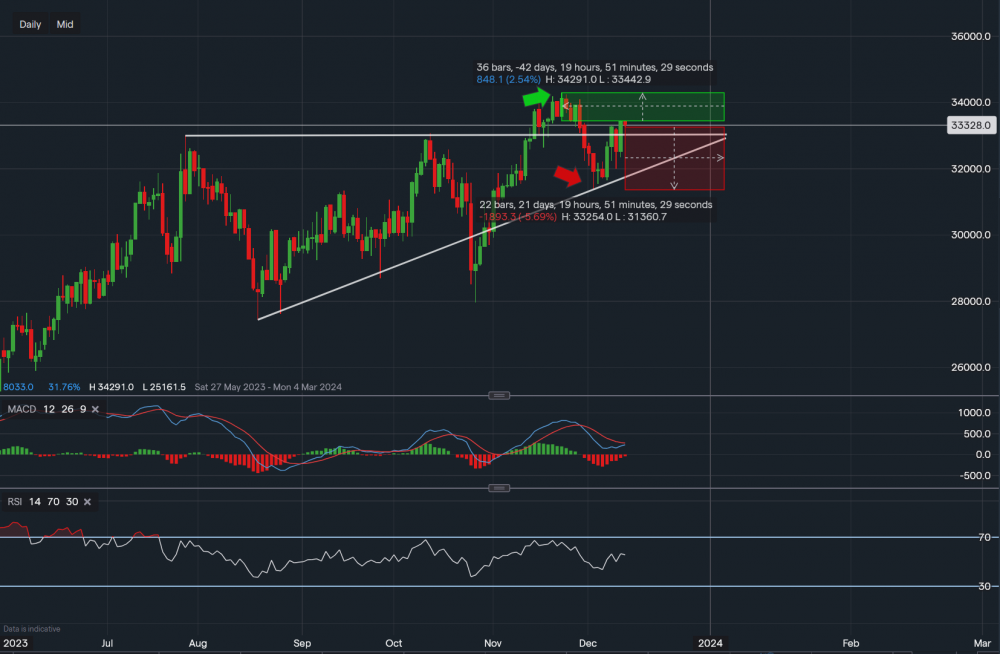
Chart & Data from IG
Taking a look at Meta as its share price has climbed and closed above the resistance trendline once again. Currently, its shares sit at around $333.28 a share and the price has closed above the trendline in yesterday’s session at $334.26. We can see that Meta tested the support along the supportive trendline of the triangle, earlier in the month, but has since bounced back. The primary focus towards the upside is the resistance of $342.91, which is around a 2.4% gain from current levels. A break above it would be a bullish indication and could then see the price rise higher, with the target then in and around $350. However, with Jerome Powell expected to speak later, we may see some volatility in US equities. Therefore, towards the downside, the previous resistance of $329.96 is now acting as support once again. A move below would see the price back in the triangle area, with the following support levels reading $323.51 and $319.08 (along the supportive trendline). Looking at the technical indicators, the MACD is still slightly negative but volume has almost flattened out and looks like it may turn positive. Whereas the RSI is now back to positive as it reads 55.

Tradable assets:
Min.Deposit:
Max Leverage:
FCA:

Rating:


 Earnings Calendar
  Economic Calendar
  VAT Calculator
  Tax Free Childcare Calculator
 Percentage Calculator
 Compound Interest Calculator
  Loan Overpayment Calculator
 Mortgage Calculator
 Credit Card Calculator
 Investing
  Economics
 Trading
  Technical Analysis
  Personal Finance
 Calculator


