General Dynamics (GD) Fundamental and Technical Stock Analysis: Can the Defence Prime Keep Outperforming?
$364.70
04 Mar 2026, 12:54
Neutral

Join Minipip Academy and access free courses in investing, trading, economics, and more.
Sign Up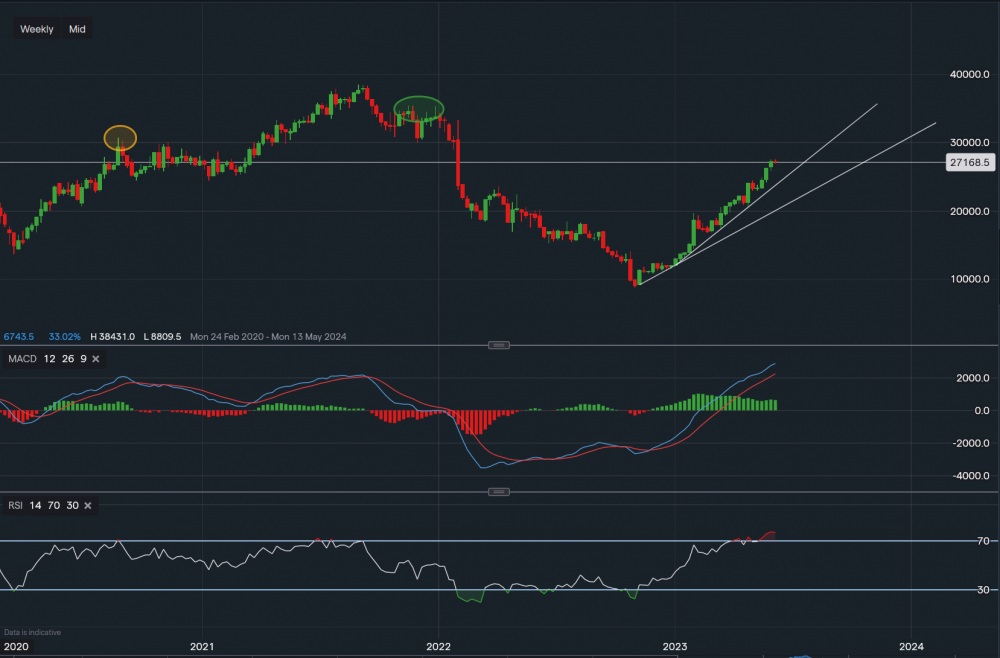
Chart & Data from IG
Meta is now having to compete with Apple regarding the virtual reality market. Apple announced on Monday that it will be releasing a new product at the start of next year, a headset called The Vision Pro. Meta fell around 77% last year following high inflation and the rise of interest rates, it is now up 207% YTD and is currently trading at around $271.68 a share. Meta is now approaching a key resistance point on the weekly timeframe sitting at $307.45 (orange oval), a break above this price level may rise much higher towards the cluster highlighted by the green oval. Or respectively, $330-$340. However, this is more likely in the longer term. Support is well established below with the first key support level sitting at $256.74, which can be found along the trendline to the left. A break below this trendline could see a slide towards the following trendline support, or respectively $232.93. Looking at the technical indicators, MACD is positive and so is the RSI as it reads 76. Similar to the previous tech stocks we have analysed in the last 24 hours, the RSI does suggest that the stock is overbought. So, a short-term retracement could occur.

Tradable assets:
Min.Deposit:
Max Leverage:
FCA:

Rating:


 Earnings Calendar
  Economic Calendar
  VAT Calculator
  Tax Free Childcare Calculator
 Percentage Calculator
 Compound Interest Calculator
  Loan Overpayment Calculator
 Mortgage Calculator
 Credit Card Calculator
 Investing
  Economics
 Trading
  Technical Analysis
  Personal Finance
 Calculator


